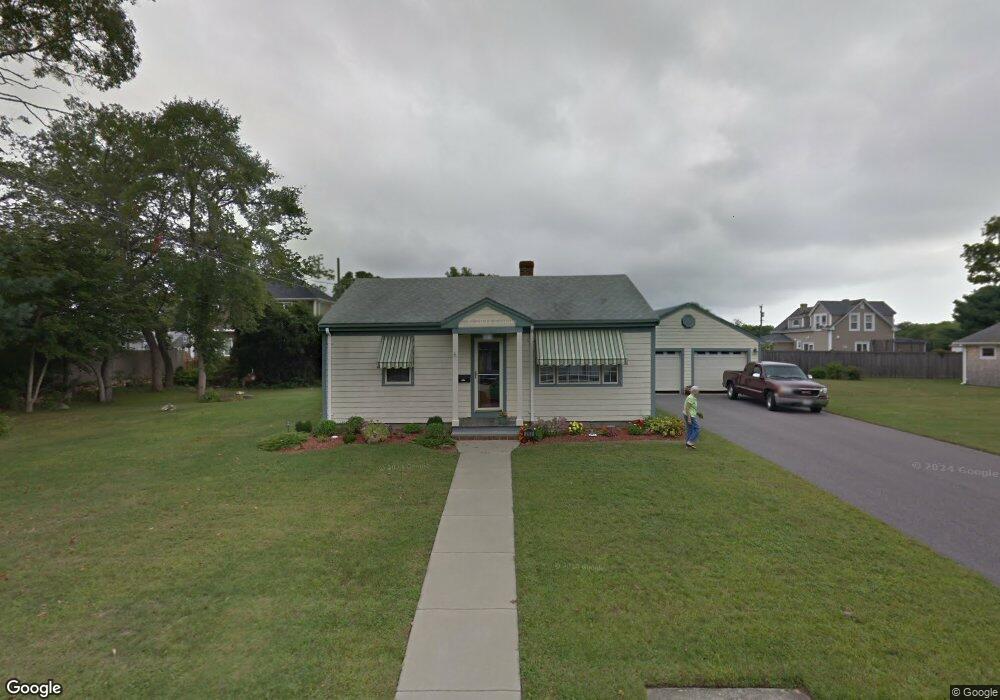
203 Rogers St South Dartmouth, MA 02748
Bliss Corner NeighborhoodEstimated Value: $395,000 - $445,000
2
Beds
1
Bath
768
Sq Ft
$541/Sq Ft
Est. Value
About This Home
This home is located at 203 Rogers St, South Dartmouth, MA 02748 and is currently estimated at $415,622, approximately $541 per square foot. 203 Rogers St is a home located in Bristol County with nearby schools including Dartmouth High School and St. Teresa of Calcutta School.
Ownership History
Date
Name
Owned For
Owner Type
Purchase Details
Closed on
Apr 30, 2020
Sold by
Alferes Eleanor and Alferes Glen A
Bought by
Alferes Glen A and Alferes Eleanor
Current Estimated Value
Purchase Details
Closed on
Apr 2, 2020
Sold by
Alferes Anthony F and Alferes Eleanor
Bought by
Alferes Eleanor and Alferes Glen A
Purchase Details
Closed on
Oct 1, 2008
Sold by
Alferes Anthony F
Bought by
Anthony F & E Alferes Re
Create a Home Valuation Report for This Property
The Home Valuation Report is an in-depth analysis detailing your home's value as well as a comparison with similar homes in the area
Home Values in the Area
Average Home Value in this Area
Purchase History
| Date | Buyer | Sale Price | Title Company |
|---|---|---|---|
| Alferes Glen A | -- | None Available | |
| Alferes Eleanor | -- | None Available | |
| Anthony F & E Alferes Re | -- | -- |
Source: Public Records
Tax History Compared to Growth
Tax History
| Year | Tax Paid | Tax Assessment Tax Assessment Total Assessment is a certain percentage of the fair market value that is determined by local assessors to be the total taxable value of land and additions on the property. | Land | Improvement |
|---|---|---|---|---|
| 2025 | $2,375 | $275,900 | $120,900 | $155,000 |
| 2024 | $2,335 | $268,700 | $120,900 | $147,800 |
| 2023 | $2,344 | $255,600 | $120,900 | $134,700 |
| 2022 | $2,328 | $235,200 | $120,900 | $114,300 |
| 2021 | $2,236 | $215,800 | $117,400 | $98,400 |
| 2020 | $2,189 | $210,900 | $116,200 | $94,700 |
| 2019 | $2,135 | $205,300 | $111,500 | $93,800 |
| 2018 | $1,986 | $198,600 | $113,900 | $84,700 |
| 2017 | $1,891 | $188,700 | $105,200 | $83,500 |
| 2016 | $1,750 | $172,200 | $93,000 | $79,200 |
| 2015 | $1,694 | $167,100 | $86,900 | $80,200 |
| 2014 | $1,667 | $163,300 | $84,500 | $78,800 |
Source: Public Records
Map
Nearby Homes