Estimated Value: $161,445 - $237,000
2
Beds
1
Bath
882
Sq Ft
$239/Sq Ft
Est. Value
About This Home
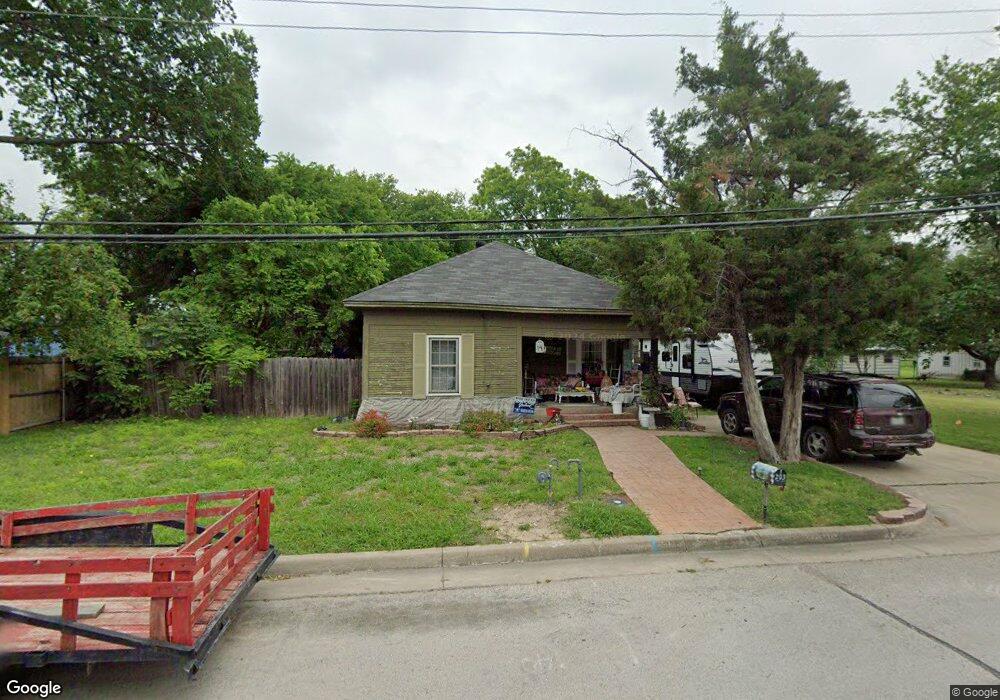
This home is located at 203 S Cottonbelt Ave, Wylie, TX 75098 and is currently estimated at $210,861, approximately $239 per square foot. 203 S Cottonbelt Ave is a home located in Collin County with nearby schools including T.F. Birmingham Elementary School, Frank Mcmillan Junior High School, and Davis Intermediate School.
Ownership History
Date
Name
Owned For
Owner Type
Purchase Details
Closed on
Nov 22, 2017
Sold by
Gay Jason and Gay Denise
Bought by
Watson Craig Duane and Gowdy Laura Bonne
Current Estimated Value
Purchase Details
Closed on
Dec 5, 2014
Sold by
Gt Construction Inc
Bought by
Gay Jason and Gay Denise
Home Financials for this Owner
Home Financials are based on the most recent Mortgage that was taken out on this home.
Original Mortgage
$56,000
Interest Rate
3.93%
Mortgage Type
Purchase Money Mortgage
Purchase Details
Closed on
Apr 29, 2004
Sold by
Taylor Patsy June
Bought by
Gt Construction Inc
Home Financials for this Owner
Home Financials are based on the most recent Mortgage that was taken out on this home.
Original Mortgage
$20,000
Interest Rate
5.38%
Mortgage Type
Purchase Money Mortgage
Create a Home Valuation Report for This Property
The Home Valuation Report is an in-depth analysis detailing your home's value as well as a comparison with similar homes in the area
Home Values in the Area
Average Home Value in this Area
Purchase History
| Date | Buyer | Sale Price | Title Company |
|---|---|---|---|
| Watson Craig Duane | -- | None Available | |
| Gay Jason | -- | Ltic | |
| Gt Construction Inc | -- | -- |
Source: Public Records
Mortgage History
| Date | Status | Borrower | Loan Amount |
|---|---|---|---|
| Previous Owner | Gay Jason | $56,000 | |
| Previous Owner | Gt Construction Inc | $20,000 |
Source: Public Records
Tax History Compared to Growth
Tax History
| Year | Tax Paid | Tax Assessment Tax Assessment Total Assessment is a certain percentage of the fair market value that is determined by local assessors to be the total taxable value of land and additions on the property. | Land | Improvement |
|---|---|---|---|---|
| 2025 | $590 | $88,538 | $90,000 | $66,213 |
| 2024 | $590 | $80,489 | $55,000 | $51,779 |
| 2023 | $590 | $73,172 | $55,000 | $57,446 |
| 2022 | $1,459 | $66,520 | $45,000 | $58,776 |
| 2021 | $1,423 | $64,079 | $40,000 | $24,079 |
| 2020 | $1,365 | $59,181 | $40,000 | $19,181 |
| 2019 | $1,313 | $49,977 | $30,000 | $19,977 |
| 2018 | $1,397 | $51,879 | $30,000 | $21,879 |
| 2017 | $1,014 | $37,653 | $20,000 | $17,653 |
| 2016 | $822 | $29,586 | $15,000 | $14,586 |
| 2015 | $757 | $29,313 | $15,000 | $14,313 |
Source: Public Records
Map
Nearby Homes
- 205 S Cottonbelt Ave
- 300 S Cottonbelt Ave Unit 3A
- 420 W Oak St
- 111 N Keefer Dr
- 107 N Winding Oaks Dr
- 404 W Jefferson St
- 307 W Brown St
- 310 Austin Ave
- 309 Sikorsky Ct
- 314 Stephanie St
- 702 S Ballard Ave
- 804 Memorial Dr
- 303 N 2nd St
- 315 Celia Cir
- 115 Pullman Place
- 1022 Debby Ct
- 301 S 3rd St
- 329 S 2nd St
- 205 Stone Cir
- 903 Mardi Gras Ln
- 201 S Cottonbelt Ave
- 311 Elliot St
- 206 S Keefer Dr
- 210 S Keefer Dr
- 309 Elliot St
- 214 S Keefer Dr
- 310 Elliot St
- 202 S Cottonbelt Ave
- 204 S Cottonbelt Ave
- 200 S Cottonbelt Ave
- 100 S Elliot St
- 105 S Cottonbelt Ave
- 301 S Cottonbelt Ave
- 103 S Cottonbelt Ave
- 400 Fleming St
- 401 Elliot St
- 402 Fleming St
- 303 W Oak St
- 118 S Birmingham St
- 102 S Cottonbelt Ave