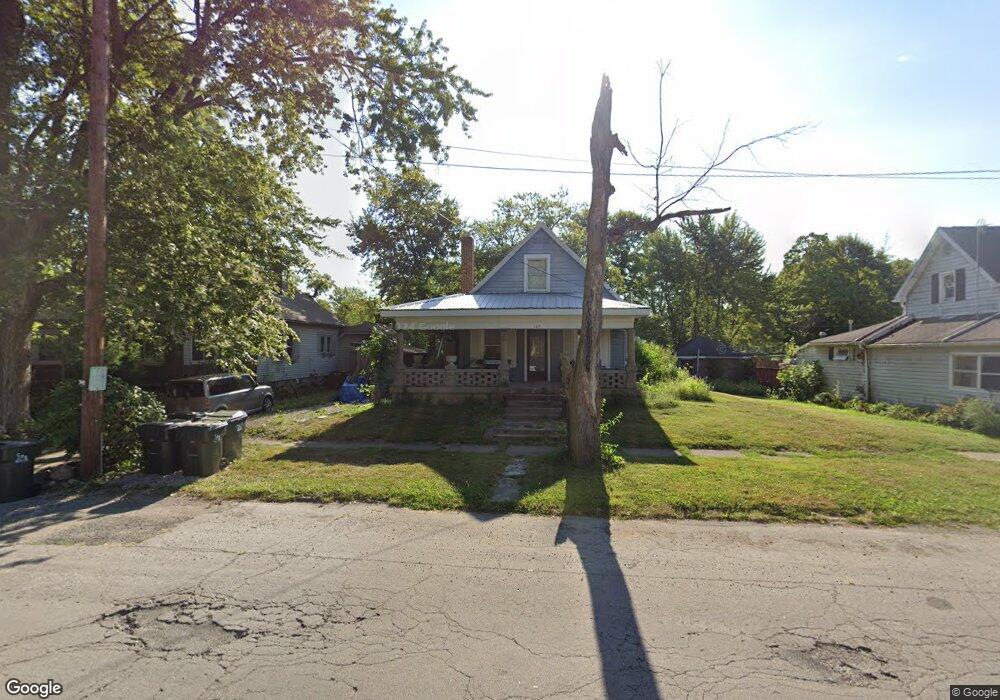
203 S Main St Carthage, IN 46115
Estimated Value: $177,000 - $190,000
3
Beds
2
Baths
2,540
Sq Ft
$72/Sq Ft
Est. Value
About This Home
This home is located at 203 S Main St, Carthage, IN 46115 and is currently estimated at $182,062, approximately $71 per square foot. 203 S Main St is a home located in Rush County with nearby schools including Knightstown Elementary School, Knightstown Intermediate School, and Knightstown High School.
Ownership History
Date
Name
Owned For
Owner Type
Purchase Details
Closed on
Oct 20, 2022
Sold by
Samson Stephen R and Samson Kim A
Bought by
Smith Michael
Current Estimated Value
Home Financials for this Owner
Home Financials are based on the most recent Mortgage that was taken out on this home.
Original Mortgage
$9,294
Outstanding Balance
$6,839
Interest Rate
6.7%
Mortgage Type
New Conventional
Estimated Equity
$175,223
Purchase Details
Closed on
Jun 5, 2018
Sold by
Bank Of New York Mellon
Bought by
Samson Stephen R and Alhaidah Kim A
Home Financials for this Owner
Home Financials are based on the most recent Mortgage that was taken out on this home.
Original Mortgage
$49,200
Interest Rate
4.5%
Mortgage Type
New Conventional
Purchase Details
Closed on
Nov 2, 2017
Sold by
Hite Charles E and Hite Sharon K
Bought by
The Bank Of New York Mellon and Cwalt Inc
Create a Home Valuation Report for This Property
The Home Valuation Report is an in-depth analysis detailing your home's value as well as a comparison with similar homes in the area
Home Values in the Area
Average Home Value in this Area
Purchase History
| Date | Buyer | Sale Price | Title Company |
|---|---|---|---|
| Smith Michael | -- | Atlantis Title | |
| Samson Stephen R | -- | First American Mortgage Solu | |
| The Bank Of New York Mellon | $62,300 | None Available |
Source: Public Records
Mortgage History
| Date | Status | Borrower | Loan Amount |
|---|---|---|---|
| Open | Smith Michael | $9,294 | |
| Open | Smith Michael | $150,253 | |
| Previous Owner | Samson Stephen R | $49,200 |
Source: Public Records
Tax History Compared to Growth
Tax History
| Year | Tax Paid | Tax Assessment Tax Assessment Total Assessment is a certain percentage of the fair market value that is determined by local assessors to be the total taxable value of land and additions on the property. | Land | Improvement |
|---|---|---|---|---|
| 2024 | $1,747 | $174,700 | $15,300 | $159,400 |
| 2023 | $1,628 | $162,800 | $15,300 | $147,500 |
| 2022 | $859 | $91,800 | $15,300 | $76,500 |
| 2021 | $856 | $82,800 | $15,300 | $67,500 |
| 2020 | $841 | $82,800 | $15,300 | $67,500 |
| 2019 | $806 | $82,800 | $15,300 | $67,500 |
| 2018 | $1,190 | $114,600 | $15,300 | $99,300 |
| 2017 | $2,319 | $113,700 | $15,300 | $98,400 |
| 2016 | $2,270 | $111,500 | $15,100 | $96,400 |
| 2014 | $1,026 | $106,800 | $14,600 | $92,200 |
| 2013 | $1,026 | $106,800 | $14,600 | $92,200 |
Source: Public Records
Map
Nearby Homes
- 307 Henley Ave
- 4 W Henley St
- 207 E Log St
- 717 Henley Ave
- 308 Winters Way
- 405 E 5th St
- 726 N Main St
- 6053 N 800 W
- 5854 N 800 W
- 11020 W Us Highway 40
- 263 S Carthage Rd
- 308 S West St
- 225 S Carthage Rd
- 132 S East St
- 315 Blue River Dr
- 306 Blue River Dr
- 308 Blue River Dr
- 324 Blue River Dr
- 307 Blue River Dr
- 151 S Madison St
- 201 S Main St
- 206 S Main St
- 301 S Main St
- 3 E Log St
- 5 E Log St
- 303 S Main St
- 109 S Main St
- 109 S Main St
- 305 S Main St
- 108 S Main St
- 302 S Main St
- 107 S Main St
- 106 S Main St
- 0 S Main St Unit 21592863
- 0 S Main St Unit 21115282
- 0 S Main St Unit 21154258
- 0 S Main St Unit 21186374
- 0 S Main St Unit MBR21809318
- 108 S East St
- 105 S Main St