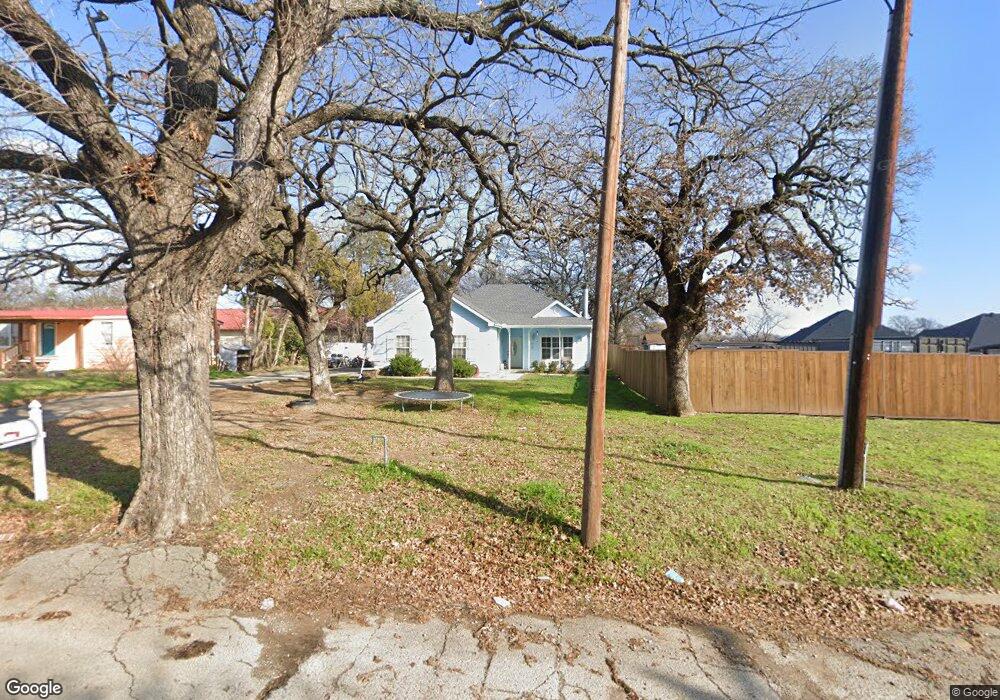
203 S Tower St Weatherford, TX 76086
Estimated Value: $222,000 - $267,000
--
Bed
--
Bath
1,260
Sq Ft
$194/Sq Ft
Est. Value
About This Home
This home is located at 203 S Tower St, Weatherford, TX 76086 and is currently estimated at $244,496, approximately $194 per square foot. 203 S Tower St is a home located in Parker County with nearby schools including Ikard Elementary School, Tison Middle School, and Weatherford High School.
Ownership History
Date
Name
Owned For
Owner Type
Purchase Details
Closed on
Mar 8, 2021
Sold by
Nickols Lloyd Allen and Nickols Lloyd Allen
Bought by
Nickols Shelah Merea Mcweth and Nickols Shelah Merea
Current Estimated Value
Purchase Details
Closed on
May 1, 2017
Sold by
Wt Tower Aprtments Llc
Bought by
Beaver Mike and Green Richard
Purchase Details
Closed on
Nov 30, 2012
Sold by
A & A Systems Inc
Bought by
Ensor Caleb
Purchase Details
Closed on
Oct 9, 2009
Sold by
Rowell Chad
Bought by
Nickols Lloyd
Home Financials for this Owner
Home Financials are based on the most recent Mortgage that was taken out on this home.
Original Mortgage
$105,552
Interest Rate
5.1%
Mortgage Type
FHA
Purchase Details
Closed on
Aug 19, 2003
Sold by
A & A Systems Inc
Bought by
Nickols Lloyd
Create a Home Valuation Report for This Property
The Home Valuation Report is an in-depth analysis detailing your home's value as well as a comparison with similar homes in the area
Home Values in the Area
Average Home Value in this Area
Purchase History
| Date | Buyer | Sale Price | Title Company |
|---|---|---|---|
| Nickols Shelah Merea Mcweth | -- | None Available | |
| Beaver Mike | -- | Providence Title Company | |
| Ensor Caleb | -- | None Available | |
| Nickols Lloyd | -- | None Available | |
| Nickols Lloyd | -- | -- |
Source: Public Records
Mortgage History
| Date | Status | Borrower | Loan Amount |
|---|---|---|---|
| Previous Owner | Nickols Lloyd | $105,552 |
Source: Public Records
Tax History Compared to Growth
Tax History
| Year | Tax Paid | Tax Assessment Tax Assessment Total Assessment is a certain percentage of the fair market value that is determined by local assessors to be the total taxable value of land and additions on the property. | Land | Improvement |
|---|---|---|---|---|
| 2025 | $2,512 | $202,499 | -- | -- |
| 2024 | $2,512 | $184,090 | $40,000 | $144,090 |
| 2023 | $2,512 | $169,330 | $0 | $0 |
| 2022 | $3,415 | $153,940 | $15,000 | $138,940 |
| 2021 | $3,506 | $153,940 | $15,000 | $138,940 |
| 2020 | $3,207 | $132,730 | $15,000 | $117,730 |
| 2019 | $3,301 | $132,730 | $15,000 | $117,730 |
| 2018 | $3,015 | $117,530 | $15,000 | $102,530 |
| 2017 | $2,951 | $117,530 | $15,000 | $102,530 |
| 2016 | $2,683 | $101,970 | $15,000 | $86,970 |
| 2015 | $2,258 | $101,970 | $15,000 | $86,970 |
| 2014 | $2,431 | $105,160 | $15,000 | $90,160 |
Source: Public Records
Map
Nearby Homes
- Lot 15 Clover Cir
- Lot 14 Clover Cir
- 213 S Line St
- 1003 E Columbia St
- TBD Vine St
- 215 S Denton St
- 110 Pine St
- 228 Allen St
- 214 Cedar St
- 916 El Dorado St
- 109 N Mill St
- 249 Wandering Ln
- 934 Eldorado St
- 936 Eldorado St
- The Chisholm Plan at Hickory Place Addition
- 101 Meadow Ct
- 1029 Inverness Dr
- 225 Legacy Blvd
- 522 Crow Ave
- 107 Hickory Ln
- 117 Clover Cir
- 205 S Tower St
- 207 S Tower St
- 115 Clover Cir
- 115 S Tower St
- 211 S Tower St
- 206 S Tower St
- 123 Clover Cir
- 202 S Tower St
- 112 Clover Cir
- 201 Clover Cir
- 114 S Tower St
- 109 S Tower St Unit 103
- 109 S Tower St
- 208 S Tower St
- 215 S Tower St
- 202 Clover Cir
- 110 Clover Cir
- TBD Clover Cir
- 204 Clover Cir