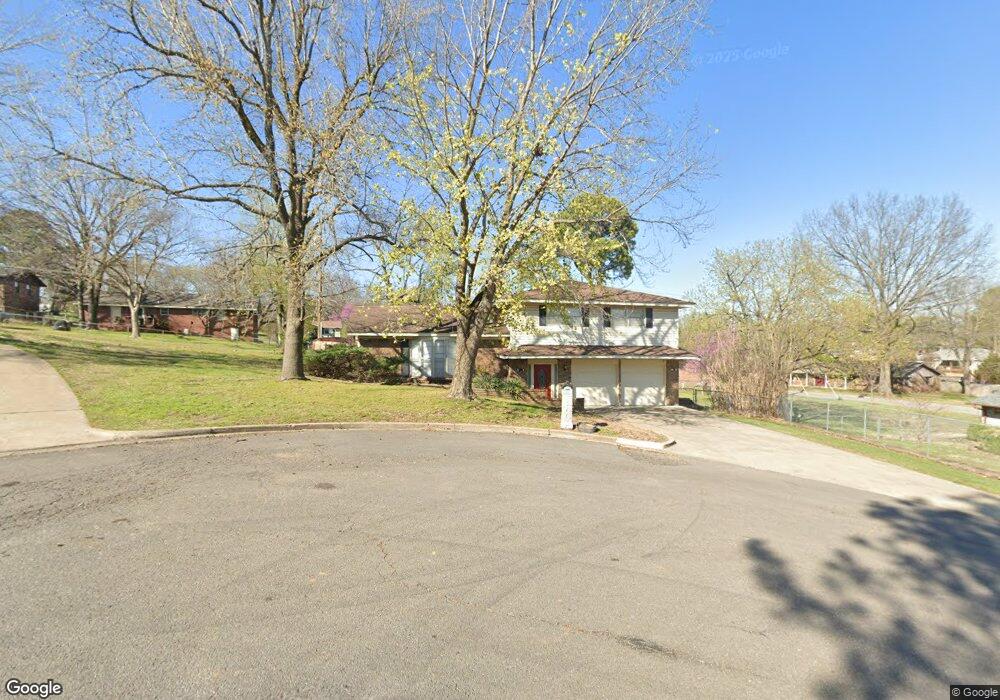
203 Sandy Cir Tahlequah, OK 74464
Estimated Value: $207,216 - $276,000
3
Beds
3
Baths
2,479
Sq Ft
$98/Sq Ft
Est. Value
About This Home
This home is located at 203 Sandy Cir, Tahlequah, OK 74464 and is currently estimated at $243,804, approximately $98 per square foot. 203 Sandy Cir is a home located in Cherokee County with nearby schools including Greenwood Elementary School, Cherokee Elementary School, and Tahlequah Middle School.
Ownership History
Date
Name
Owned For
Owner Type
Purchase Details
Closed on
Jul 8, 2011
Sold by
Foster Michael O and Foster Rhonda M
Bought by
Coffland Donald and Coffland Lisa
Current Estimated Value
Home Financials for this Owner
Home Financials are based on the most recent Mortgage that was taken out on this home.
Original Mortgage
$104,800
Outstanding Balance
$71,873
Interest Rate
4.52%
Mortgage Type
New Conventional
Estimated Equity
$171,931
Purchase Details
Closed on
Mar 3, 2010
Sold by
Qualls Linda K and Qualls Linda
Bought by
Foster Michael O and Foster Rhonda M
Create a Home Valuation Report for This Property
The Home Valuation Report is an in-depth analysis detailing your home's value as well as a comparison with similar homes in the area
Home Values in the Area
Average Home Value in this Area
Purchase History
| Date | Buyer | Sale Price | Title Company |
|---|---|---|---|
| Coffland Donald | $131,000 | American Eagle Title Group | |
| Foster Michael O | $91,000 | Tahlequah Abstract Closing S |
Source: Public Records
Mortgage History
| Date | Status | Borrower | Loan Amount |
|---|---|---|---|
| Open | Coffland Donald | $104,800 |
Source: Public Records
Tax History Compared to Growth
Tax History
| Year | Tax Paid | Tax Assessment Tax Assessment Total Assessment is a certain percentage of the fair market value that is determined by local assessors to be the total taxable value of land and additions on the property. | Land | Improvement |
|---|---|---|---|---|
| 2025 | $1,188 | $12,472 | $1,403 | $11,069 |
| 2024 | $1,188 | $12,543 | $1,403 | $11,140 |
| 2023 | $1,188 | $14,357 | $1,146 | $13,211 |
| 2022 | $1,332 | $14,357 | $1,146 | $13,211 |
| 2021 | $1,337 | $14,357 | $1,146 | $13,211 |
| 2020 | $1,334 | $14,068 | $1,146 | $12,922 |
| 2019 | $1,259 | $13,399 | $1,146 | $12,253 |
| 2018 | $1,213 | $12,760 | $1,146 | $11,614 |
| 2017 | $1,198 | $12,630 | $1,089 | $11,541 |
| 2016 | $1,148 | $12,028 | $1,089 | $10,939 |
| 2015 | $1,075 | $11,456 | $1,089 | $10,367 |
| 2014 | $1,253 | $13,310 | $770 | $12,540 |
Source: Public Records
Map
Nearby Homes
- 201 Sandy Cir
- 306 Short St
- 757 S Bluff Ave
- 413 Greenwood Dr
- 508 Covington Place
- 528 S Muskogee Ave
- 403 S Bluff Ave
- 281 Redbud Ln
- 605 S Oak Ave
- 215 S Maple Ave
- 802 S College Ave
- 821 S College Ave
- 510 S Cherokee Ave
- 224 W Chickasaw St
- 1105 S Maple Ave
- 720 S East Ave
- 513 S State Ave
- 104 Tommye Ln
- 1005 Kaufman Ave
- 516 W Fox St