Estimated Value: $69,192
3
Beds
1
Bath
1,322
Sq Ft
$52/Sq Ft
Est. Value
About This Home
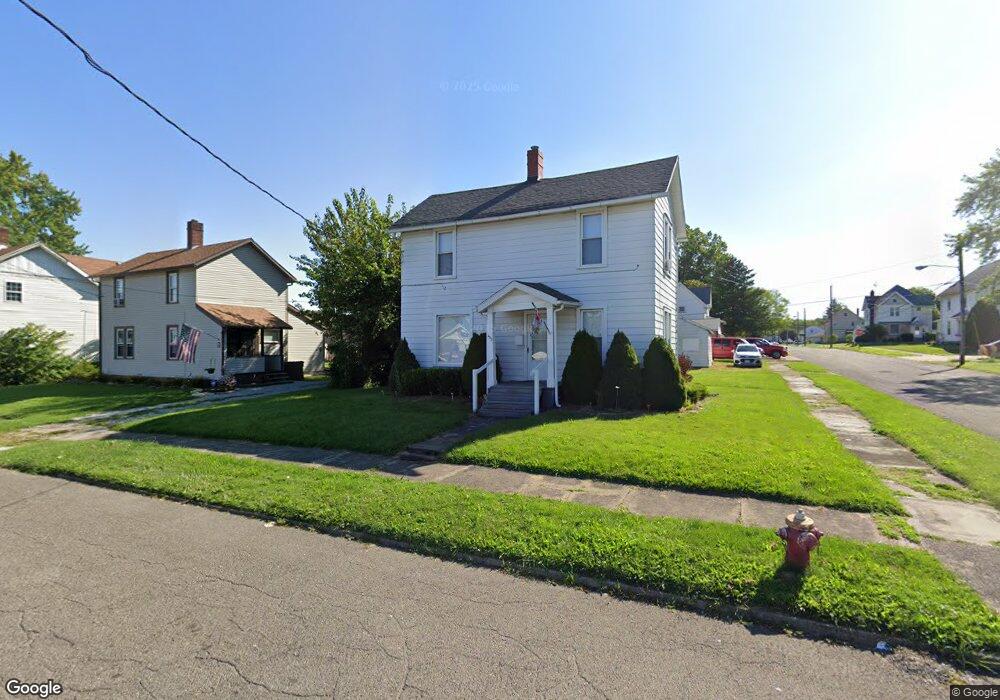
This home is located at 203 Short St, Niles, OH 44446 and is currently estimated at $69,192, approximately $52 per square foot. 203 Short St is a home located in Trumbull County with nearby schools including Niles Primary School, Niles Intermediate School, and Niles Middle School.
Ownership History
Date
Name
Owned For
Owner Type
Purchase Details
Closed on
Apr 12, 2021
Sold by
Ragan John M
Bought by
Miketa Kurtis C and Miketa Aundrea L
Current Estimated Value
Purchase Details
Closed on
Dec 28, 2005
Sold by
Predika Jerry
Bought by
Ragan John M
Home Financials for this Owner
Home Financials are based on the most recent Mortgage that was taken out on this home.
Original Mortgage
$40,000
Interest Rate
5.89%
Mortgage Type
New Conventional
Purchase Details
Closed on
Nov 18, 2005
Sold by
Predika Jerry
Bought by
Ragan John M
Home Financials for this Owner
Home Financials are based on the most recent Mortgage that was taken out on this home.
Original Mortgage
$40,000
Interest Rate
5.89%
Mortgage Type
New Conventional
Purchase Details
Closed on
Jan 1, 1990
Bought by
Anna Jack and Anna Predika
Create a Home Valuation Report for This Property
The Home Valuation Report is an in-depth analysis detailing your home's value as well as a comparison with similar homes in the area
Home Values in the Area
Average Home Value in this Area
Purchase History
| Date | Buyer | Sale Price | Title Company |
|---|---|---|---|
| Miketa Kurtis C | $23,000 | None Listed On Document | |
| Ragan John M | $40,000 | -- | |
| Ragan John M | $40,000 | -- | |
| Anna Jack | -- | -- |
Source: Public Records
Mortgage History
| Date | Status | Borrower | Loan Amount |
|---|---|---|---|
| Previous Owner | Ragan John M | $40,000 | |
| Previous Owner | Ragan John M | $40,000 |
Source: Public Records
Tax History Compared to Growth
Tax History
| Year | Tax Paid | Tax Assessment Tax Assessment Total Assessment is a certain percentage of the fair market value that is determined by local assessors to be the total taxable value of land and additions on the property. | Land | Improvement |
|---|---|---|---|---|
| 2024 | $763 | $17,790 | $3,050 | $14,740 |
| 2023 | $763 | $17,790 | $3,050 | $14,740 |
| 2022 | $591 | $11,770 | $3,050 | $8,720 |
| 2021 | $620 | $11,770 | $3,050 | $8,720 |
| 2020 | $626 | $11,770 | $3,050 | $8,720 |
| 2019 | $658 | $11,770 | $3,050 | $8,720 |
| 2018 | $991 | $11,770 | $3,050 | $8,720 |
| 2017 | $652 | $11,770 | $3,050 | $8,720 |
| 2016 | $486 | $8,690 | $3,050 | $5,640 |
| 2015 | $481 | $8,690 | $3,050 | $5,640 |
| 2014 | $483 | $8,690 | $3,050 | $5,640 |
| 2013 | $498 | $9,460 | $3,050 | $6,410 |
Source: Public Records
Map
Nearby Homes
- 322 Morse Ave
- 416 N Cedar Ave
- 409 West St
- 4,6,8 Lafayette
- 512 John St
- 719 Robbins Ave
- 719 Lafayette Ave
- 0 Federal
- 17 Belmont Ave
- 611 Mason St
- 404 N Bentley Ave
- 39 Belmont Ave
- 0 Hughes St SE
- 839 Robbins Ave
- 29 S Bentley Ave
- 158 N Arlington Ave
- 816 Fenton St
- 733 N Bentley Ave
- 737 N Bentley Ave
- 22 N Arlington Ave