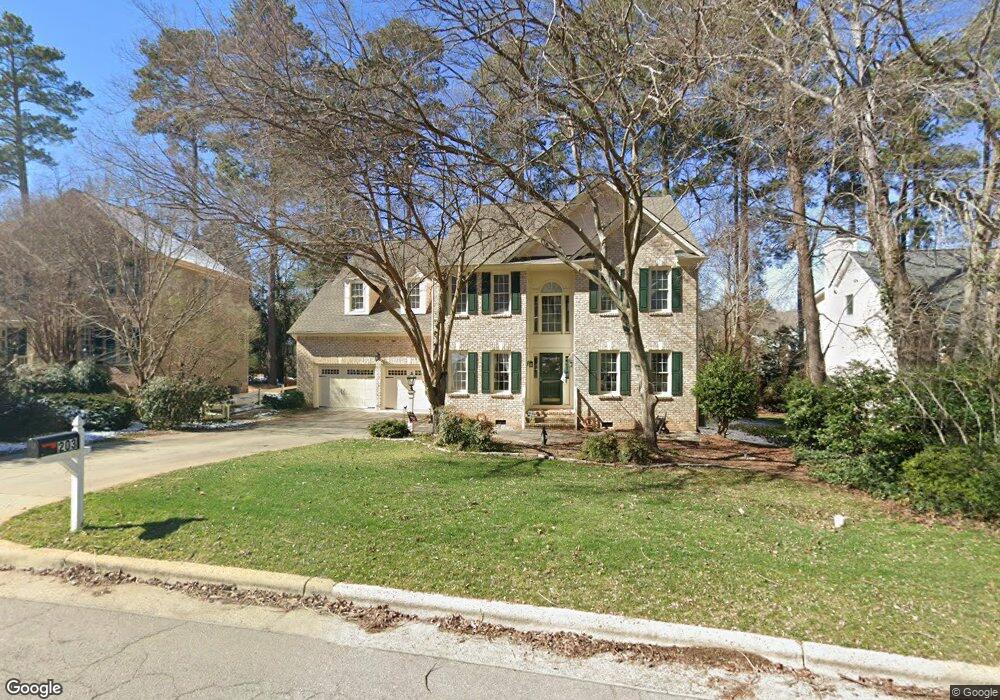
203 Stillman Creek Dr Cary, NC 27519
West Cary NeighborhoodEstimated Value: $793,000 - $902,000
4
Beds
4
Baths
3,670
Sq Ft
$237/Sq Ft
Est. Value
About This Home
This home is located at 203 Stillman Creek Dr, Cary, NC 27519 and is currently estimated at $870,394, approximately $237 per square foot. 203 Stillman Creek Dr is a home located in Wake County with nearby schools including Turner Creek Elementary School, Salem Middle, and Green Hope High.
Ownership History
Date
Name
Owned For
Owner Type
Purchase Details
Closed on
Jun 4, 2024
Sold by
Allen Colleen W and Allen William J
Bought by
Allen Living Trust and Allen
Current Estimated Value
Purchase Details
Closed on
Jun 18, 1998
Sold by
Lavelle William John and Lavelle Dawn Delynn
Bought by
Allen William J and Allen Colleen W
Home Financials for this Owner
Home Financials are based on the most recent Mortgage that was taken out on this home.
Original Mortgage
$437,750
Interest Rate
6.94%
Mortgage Type
Purchase Money Mortgage
Purchase Details
Closed on
Mar 25, 1998
Sold by
Centex International Inc
Bought by
Lavelle William John and Lavelle Dawn Delynn
Home Financials for this Owner
Home Financials are based on the most recent Mortgage that was taken out on this home.
Original Mortgage
$223,600
Interest Rate
6.37%
Create a Home Valuation Report for This Property
The Home Valuation Report is an in-depth analysis detailing your home's value as well as a comparison with similar homes in the area
Home Values in the Area
Average Home Value in this Area
Purchase History
| Date | Buyer | Sale Price | Title Company |
|---|---|---|---|
| Allen Living Trust | -- | None Listed On Document | |
| Allen William J | $285,000 | -- | |
| Lavelle William John | $279,500 | -- |
Source: Public Records
Mortgage History
| Date | Status | Borrower | Loan Amount |
|---|---|---|---|
| Previous Owner | Allen William J | $437,750 | |
| Previous Owner | Lavelle William John | $223,600 |
Source: Public Records
Tax History Compared to Growth
Tax History
| Year | Tax Paid | Tax Assessment Tax Assessment Total Assessment is a certain percentage of the fair market value that is determined by local assessors to be the total taxable value of land and additions on the property. | Land | Improvement |
|---|---|---|---|---|
| 2025 | $6,497 | $755,672 | $210,000 | $545,672 |
| 2024 | $6,356 | $755,672 | $210,000 | $545,672 |
| 2023 | $4,650 | $462,060 | $83,000 | $379,060 |
| 2022 | $4,477 | $462,060 | $83,000 | $379,060 |
| 2021 | $4,386 | $462,060 | $83,000 | $379,060 |
| 2020 | $4,410 | $462,060 | $83,000 | $379,060 |
| 2019 | $4,269 | $396,822 | $83,000 | $313,822 |
| 2018 | $4,006 | $396,822 | $83,000 | $313,822 |
| 2017 | $3,849 | $396,822 | $83,000 | $313,822 |
| 2016 | $3,792 | $396,822 | $83,000 | $313,822 |
| 2015 | $3,878 | $391,864 | $78,000 | $313,864 |
| 2014 | -- | $391,864 | $78,000 | $313,864 |
Source: Public Records
Map
Nearby Homes
- 200 Carpenter Brook Dr
- 120 Union Mills Way
- 103 Town Creek Dr
- 105 Point Harbor Dr
- 320 Wedgemere St
- 100 Wentbridge Rd
- 145 Swan Quarter Dr
- 205 Wedgemere St
- 209 Parkmeadow Dr
- 467 Methven Grove Dr
- 307 Sir Brennan Ct
- 107 Morgans Corner
- 410 Widdington Ln
- 322 Parkmeadow Dr
- 6716 Valley Woods Ln
- 722 Mcrae Rd
- 324 Farrow Glen Loop
- 203 Caraway Ln
- 320 Sutton Glen Dr
- 106 Blue Boar Ct
- 205 Stillman Creek Dr
- 201 Stillman Creek Dr
- 202 Lewey Brook Dr
- 200 Lewey Brook Dr
- 102 Lewey Brook Dr
- 207 Stillman Creek Dr
- 204 Lewey Brook Dr
- 202 Stillman Creek Dr
- 204 Stillman Creek Dr
- 209 Stillman Creek Dr
- 101 Stillman Creek Dr
- 206 Stillman Creek Dr
- 206 Lewey Brook Dr
- 100 Stillman Creek Dr
- 100 Pinestone Ct
- 103 Lewey Brook Dr
- 208 Stillman Creek Dr
- 203 Lewey Brook Dr
- 105 Lewey Brook Dr
- 111 Lewey Brook Dr