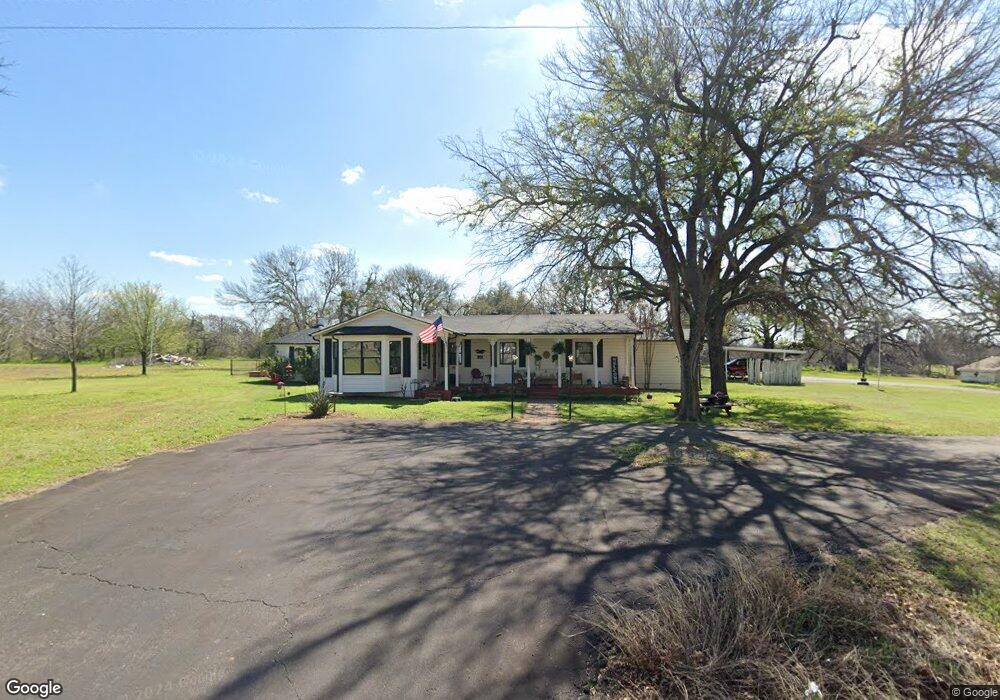
203 Taylor Rd Weatherford, TX 76087
Estimated Value: $441,739 - $618,000
3
Beds
2
Baths
2,423
Sq Ft
$217/Sq Ft
Est. Value
About This Home
This home is located at 203 Taylor Rd, Weatherford, TX 76087 and is currently estimated at $525,685, approximately $216 per square foot. 203 Taylor Rd is a home located in Parker County with nearby schools including Brock Intermediate School, Brock Junior High School, and Brock High School.
Ownership History
Date
Name
Owned For
Owner Type
Purchase Details
Closed on
May 21, 2024
Sold by
Kimbro-Clark Sue
Bought by
Lee Jordan D
Current Estimated Value
Home Financials for this Owner
Home Financials are based on the most recent Mortgage that was taken out on this home.
Original Mortgage
$422,211
Outstanding Balance
$416,291
Interest Rate
6.88%
Mortgage Type
FHA
Estimated Equity
$109,394
Purchase Details
Closed on
Dec 14, 2023
Sold by
Clark Sue
Bought by
Parker County
Purchase Details
Closed on
Jun 17, 2020
Sold by
Wilson Celeste Mae
Bought by
Kimbro Clark Sue
Home Financials for this Owner
Home Financials are based on the most recent Mortgage that was taken out on this home.
Original Mortgage
$198,750
Interest Rate
3.1%
Mortgage Type
New Conventional
Purchase Details
Closed on
Oct 10, 2002
Sold by
Kimbro-Clark Sue
Bought by
Clark Garry L and Sue Kimbro Clark
Create a Home Valuation Report for This Property
The Home Valuation Report is an in-depth analysis detailing your home's value as well as a comparison with similar homes in the area
Home Values in the Area
Average Home Value in this Area
Purchase History
| Date | Buyer | Sale Price | Title Company |
|---|---|---|---|
| Lee Jordan D | -- | None Listed On Document | |
| Parker County | -- | None Listed On Document | |
| Kimbro Clark Sue | -- | Texas Title | |
| Clark Garry L | -- | -- |
Source: Public Records
Mortgage History
| Date | Status | Borrower | Loan Amount |
|---|---|---|---|
| Open | Lee Jordan D | $422,211 | |
| Previous Owner | Kimbro Clark Sue | $198,750 |
Source: Public Records
Tax History Compared to Growth
Tax History
| Year | Tax Paid | Tax Assessment Tax Assessment Total Assessment is a certain percentage of the fair market value that is determined by local assessors to be the total taxable value of land and additions on the property. | Land | Improvement |
|---|---|---|---|---|
| 2025 | $2,191 | $201,400 | $126,110 | $75,290 |
| 2024 | $2,191 | $277,441 | -- | -- |
| 2023 | $2,191 | $252,220 | $0 | $0 |
| 2022 | $4,655 | $240,980 | $117,690 | $123,290 |
| 2021 | $4,450 | $240,980 | $117,690 | $123,290 |
| 2020 | $4,102 | $189,500 | $77,730 | $111,770 |
| 2019 | $4,417 | $189,500 | $77,730 | $111,770 |
| 2018 | $4,320 | $184,550 | $55,610 | $128,940 |
| 2017 | $4,246 | $184,550 | $55,610 | $128,940 |
| 2016 | $4,223 | $183,560 | $44,590 | $138,970 |
| 2015 | $3,283 | $183,560 | $44,590 | $138,970 |
| 2014 | $3,381 | $169,260 | $43,130 | $126,130 |
Source: Public Records
Map
Nearby Homes
- 100 Taylor Rd
- 101 Heritage Springs Dr
- 223 Ruby Dr
- 401 Taylor Rd
- 0000 Heritage Springs Dr
- 109 Heritage Springs Dr
- 113 Heritage Springs Dr
- 105 Beaver Creek Ct
- 124 Heritage Springs Dr
- 104 Beaver Creek Ct
- 125 Heritage Springs Dr
- 128 Heritage Springs Dr
- 100 Beaver Creek Ct
- 129 Heritage Springs Dr
- 145 Salt Creek Ct
- 200 Salt Creek Ct
- 000 Salt Creek Ct
- 219 Salt Creek Ct
- 137 Heritage Springs Dr
- 215 Salt Creek Ct