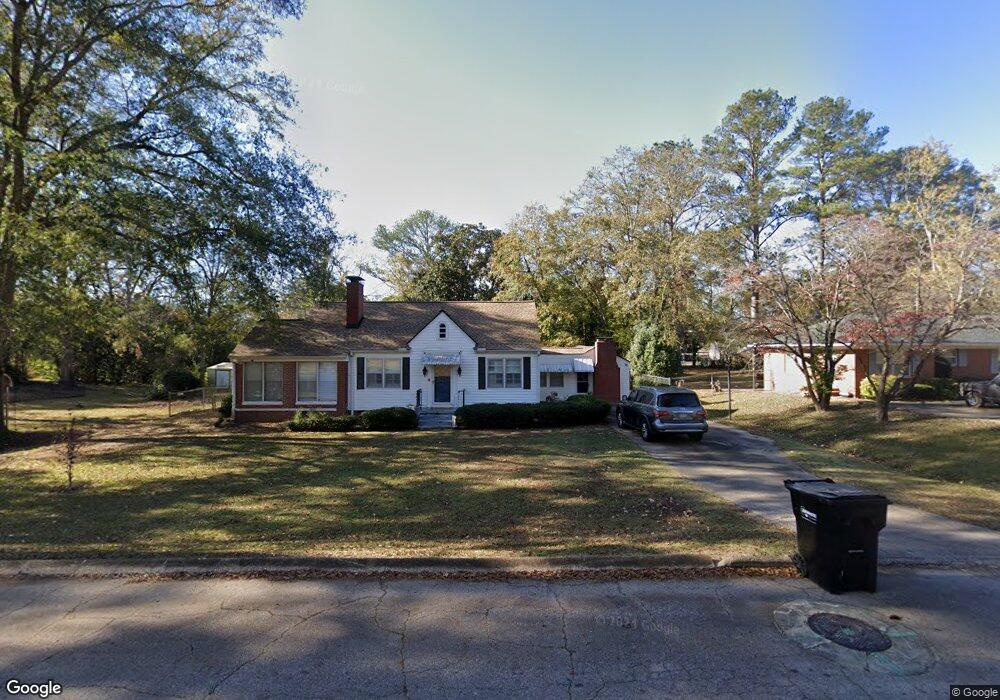
203 Teel Rd West Point, GA 31833
Estimated Value: $187,000 - $228,000
3
Beds
2
Baths
1,704
Sq Ft
$120/Sq Ft
Est. Value
About This Home
This home is located at 203 Teel Rd, West Point, GA 31833 and is currently estimated at $205,160, approximately $120 per square foot. 203 Teel Rd is a home located in Harris County with nearby schools including New Mountain Hill Elementary School, Harris County Carver Middle School, and Harris County High School.
Ownership History
Date
Name
Owned For
Owner Type
Purchase Details
Closed on
May 3, 2019
Sold by
Barber James W
Bought by
Webb Jordan Makayla and Webb William Tyler
Current Estimated Value
Home Financials for this Owner
Home Financials are based on the most recent Mortgage that was taken out on this home.
Original Mortgage
$126,262
Outstanding Balance
$109,851
Interest Rate
4%
Mortgage Type
New Conventional
Estimated Equity
$95,309
Purchase Details
Closed on
Jul 21, 2006
Sold by
Wallace Bryan Scott and Eva Hort
Bought by
Barber Willie James and Glover Michael
Home Financials for this Owner
Home Financials are based on the most recent Mortgage that was taken out on this home.
Original Mortgage
$109,250
Interest Rate
6.68%
Mortgage Type
New Conventional
Purchase Details
Closed on
Jun 28, 2001
Bought by
Wallace Bryan Scott and Eva Horton
Create a Home Valuation Report for This Property
The Home Valuation Report is an in-depth analysis detailing your home's value as well as a comparison with similar homes in the area
Home Values in the Area
Average Home Value in this Area
Purchase History
| Date | Buyer | Sale Price | Title Company |
|---|---|---|---|
| Webb Jordan Makayla | $125,000 | -- | |
| Barber Willie James | $115,000 | -- | |
| Wallace Bryan Scott | $90,500 | -- |
Source: Public Records
Mortgage History
| Date | Status | Borrower | Loan Amount |
|---|---|---|---|
| Open | Webb Jordan Makayla | $126,262 | |
| Previous Owner | Barber Willie James | $109,250 |
Source: Public Records
Tax History Compared to Growth
Tax History
| Year | Tax Paid | Tax Assessment Tax Assessment Total Assessment is a certain percentage of the fair market value that is determined by local assessors to be the total taxable value of land and additions on the property. | Land | Improvement |
|---|---|---|---|---|
| 2025 | $1,867 | $56,863 | $8,000 | $48,863 |
| 2024 | $1,712 | $55,076 | $8,000 | $47,076 |
| 2023 | $1,263 | $54,954 | $8,000 | $46,954 |
| 2022 | $1,187 | $51,872 | $8,000 | $43,872 |
| 2021 | $1,206 | $50,465 | $8,000 | $42,465 |
| 2020 | $1,194 | $50,465 | $8,000 | $42,465 |
| 2019 | $1,154 | $50,402 | $8,000 | $42,402 |
| 2018 | $1,003 | $42,265 | $8,000 | $34,265 |
| 2017 | $1,003 | $42,265 | $8,000 | $34,265 |
| 2016 | $936 | $42,066 | $8,000 | $34,066 |
| 2015 | $970 | $43,538 | $8,000 | $35,538 |
| 2014 | $973 | $43,538 | $8,000 | $35,538 |
| 2013 | -- | $43,538 | $8,000 | $35,538 |
Source: Public Records
Map
Nearby Homes
- 128 Highland Dr
- 112 Hillcrest Rd
- 311 E 4th St
- 804 E 6th St
- 509 Cleveland St
- 713 Avenue H
- 608 S 1st Ave
- 302 N 6th Ave
- 712 4th Ave
- 612 S 3rd Ave
- 0 Arrowhead Dr Unit 10451860
- 514 N 8th Ave
- 314 S 6th Ave
- 806 N 5th St
- 811 Cherry Dr
- 813 Cherry Dr
- 1223 E 3rd Ave
- 1007 4th Ave
- 1008 E 12th St
- 902 S Jennings Ave
- 205 Teel Rd
- 125 Francolyn Terrace
- 211 Briarcliff Rd
- 207 Teel Rd
- 204 Avenue C
- 202 Avenue C
- 108 Hillcrest Rd
- 206 Avenue C
- 200 Teel Rd
- 200 Avenue C
- 130 Highland Dr
- 130 Highland Dr Unit 319
- 209 Teel Rd
- 104 Hillcrest Rd
- 110 Hillcrest Rd
- 100 Briarcliff Rd
- 133 Highland Dr
- 102 Hillcrest Rd
- 201 Avenue C
- 203 Avenue C