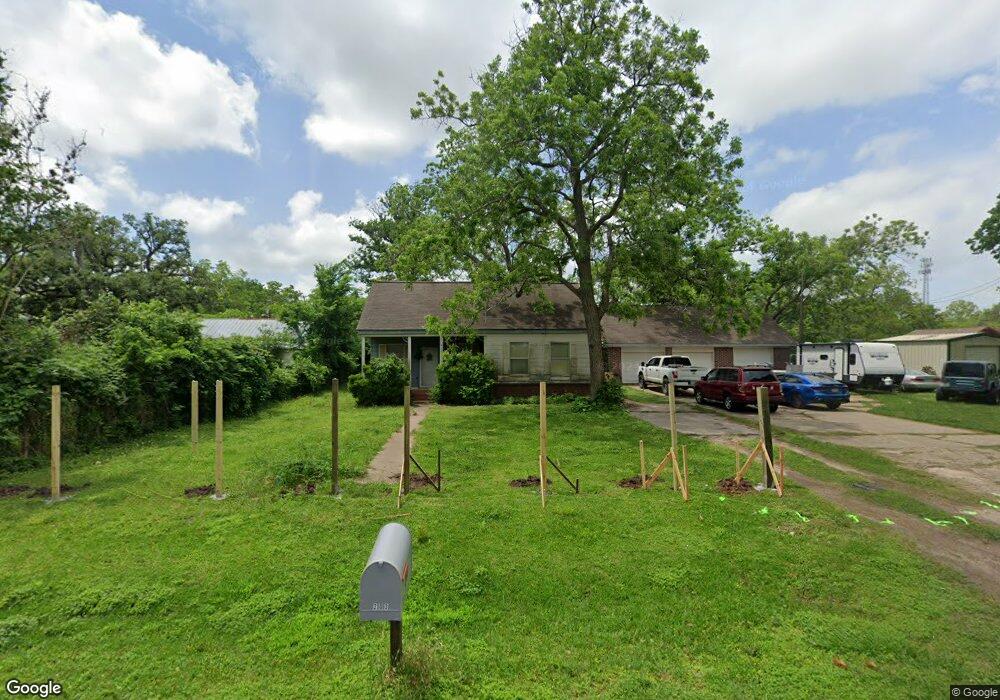
203 Travis St Brazoria, TX 77422
Estimated Value: $180,000 - $248,000
4
Beds
2
Baths
1,932
Sq Ft
$107/Sq Ft
Est. Value
About This Home
This home is located at 203 Travis St, Brazoria, TX 77422 and is currently estimated at $206,288, approximately $106 per square foot. 203 Travis St is a home located in Brazoria County.
Ownership History
Date
Name
Owned For
Owner Type
Purchase Details
Closed on
Apr 12, 2024
Sold by
Langston William R and Langston Deia L
Bought by
Langston William D and Langston Brandy L
Current Estimated Value
Purchase Details
Closed on
Aug 11, 2011
Sold by
Federal Home Loan Mortgage Corporation
Bought by
Langston Williams R and Langston Deia L
Purchase Details
Closed on
Dec 14, 2010
Sold by
Narvaez Reyes and Narvaez Anita
Bought by
Hopkins James F and Hopkins Charlotte J
Purchase Details
Closed on
Feb 3, 2010
Sold by
Narvaez Reyes and Narvaez Anita
Bought by
Federal Home Loan Mortgage Corp
Purchase Details
Closed on
Aug 6, 2003
Sold by
Borel Alden Paul and Borel Deanne Sue
Bought by
Narvaez Reyes and Narvaez Anita
Home Financials for this Owner
Home Financials are based on the most recent Mortgage that was taken out on this home.
Original Mortgage
$80,605
Interest Rate
5.24%
Mortgage Type
Purchase Money Mortgage
Create a Home Valuation Report for This Property
The Home Valuation Report is an in-depth analysis detailing your home's value as well as a comparison with similar homes in the area
Home Values in the Area
Average Home Value in this Area
Purchase History
| Date | Buyer | Sale Price | Title Company |
|---|---|---|---|
| Langston William D | -- | None Listed On Document | |
| Langston Williams R | -- | None Available | |
| Hopkins James F | -- | None Available | |
| Federal Home Loan Mortgage Corp | $83,767 | None Available | |
| Narvaez Reyes | -- | Alamo Title Company |
Source: Public Records
Mortgage History
| Date | Status | Borrower | Loan Amount |
|---|---|---|---|
| Previous Owner | Narvaez Reyes | $80,605 |
Source: Public Records
Tax History Compared to Growth
Tax History
| Year | Tax Paid | Tax Assessment Tax Assessment Total Assessment is a certain percentage of the fair market value that is determined by local assessors to be the total taxable value of land and additions on the property. | Land | Improvement |
|---|---|---|---|---|
| 2025 | $2,168 | $146,810 | $25,200 | $121,610 |
| 2023 | $2,168 | $196,140 | $47,650 | $148,490 |
| 2022 | $3,048 | $134,920 | $42,040 | $92,880 |
| 2021 | $2,793 | $118,520 | $36,440 | $82,080 |
| 2020 | $2,822 | $114,060 | $33,630 | $80,430 |
| 2019 | $2,381 | $93,270 | $15,890 | $77,380 |
| 2018 | $2,246 | $87,490 | $15,260 | $72,230 |
| 2017 | $2,322 | $87,490 | $15,260 | $72,230 |
| 2016 | $2,205 | $83,080 | $12,710 | $70,370 |
| 2015 | $1,803 | $69,240 | $12,710 | $56,530 |
| 2014 | $1,803 | $67,190 | $12,710 | $54,480 |
Source: Public Records
Map
Nearby Homes
- 200 Marion St
- 301 W Travis St
- 301 Travis St
- 302 W Marion St
- 302 Marion St
- 107 W Travis St
- 106 Marion St
- 106 W Marion
- 305 Travis St
- 105 W Travis St
- 306 W Travis St
- 301 Marion St
- 309 Travis St
- 310 Marion St
- 310 W Marion St
- 902 N Market St
- 200 Velasco St
- 200 W Velasco St
- 906 N Market St
- 906 N Market St Unit 1