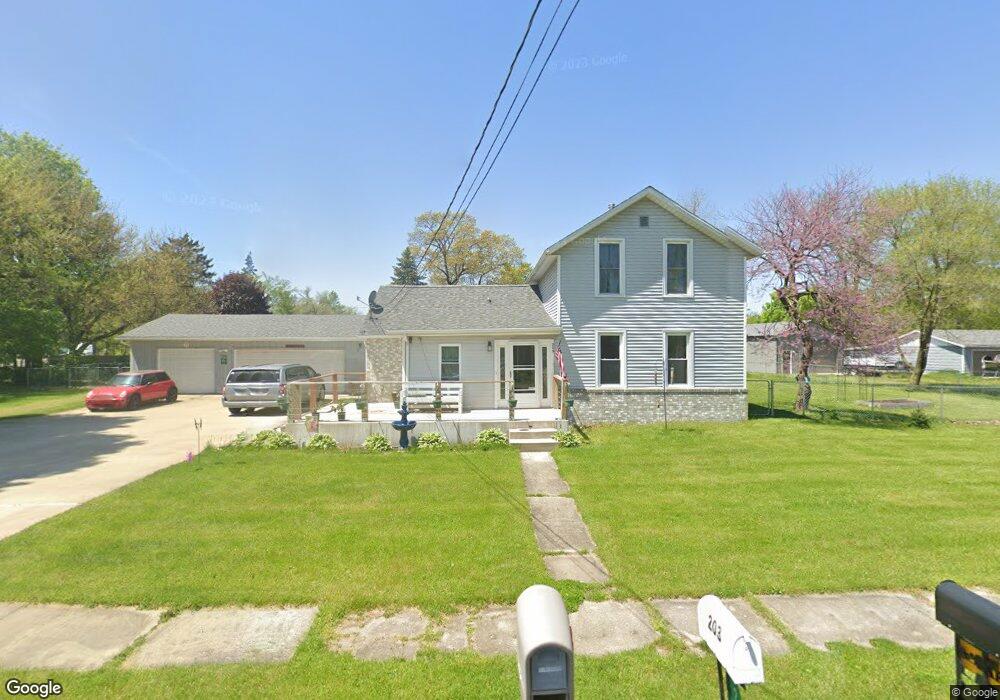
203 Trout Creek Rd Bristol, IN 46507
Estimated Value: $240,000 - $302,000
3
Beds
3
Baths
1,662
Sq Ft
$160/Sq Ft
Est. Value
About This Home
This home is located at 203 Trout Creek Rd, Bristol, IN 46507 and is currently estimated at $266,653, approximately $160 per square foot. 203 Trout Creek Rd is a home located in Elkhart County with nearby schools including Bristol Elementary School, Pierre Moran Middle School, and Elkhart High School's Freshman Division.
Ownership History
Date
Name
Owned For
Owner Type
Purchase Details
Closed on
Jul 20, 2020
Sold by
Roy Harry and Roy Harry F
Bought by
Roy Missy
Current Estimated Value
Purchase Details
Closed on
Oct 14, 2008
Sold by
Henderson Amanda
Bought by
Roy Harry
Purchase Details
Closed on
Dec 23, 2005
Sold by
Stutzman Willard A
Bought by
Roy Harry F and Henderson Amanda M
Home Financials for this Owner
Home Financials are based on the most recent Mortgage that was taken out on this home.
Original Mortgage
$106,052
Interest Rate
6.4%
Mortgage Type
FHA
Purchase Details
Closed on
May 24, 2005
Sold by
Schmidt Miles and Schmidt John
Bought by
Stutzman Willard A
Create a Home Valuation Report for This Property
The Home Valuation Report is an in-depth analysis detailing your home's value as well as a comparison with similar homes in the area
Home Values in the Area
Average Home Value in this Area
Purchase History
| Date | Buyer | Sale Price | Title Company |
|---|---|---|---|
| Roy Missy | -- | None Available | |
| Roy Harry | -- | None Available | |
| Roy Harry F | -- | Meridian Title Corp | |
| Stutzman Willard A | $71,251 | -- |
Source: Public Records
Mortgage History
| Date | Status | Borrower | Loan Amount |
|---|---|---|---|
| Previous Owner | Roy Harry F | $106,052 |
Source: Public Records
Tax History Compared to Growth
Tax History
| Year | Tax Paid | Tax Assessment Tax Assessment Total Assessment is a certain percentage of the fair market value that is determined by local assessors to be the total taxable value of land and additions on the property. | Land | Improvement |
|---|---|---|---|---|
| 2024 | $1,812 | $192,900 | $20,800 | $172,100 |
| 2022 | $1,812 | $162,100 | $20,800 | $141,300 |
| 2021 | $1,295 | $137,700 | $20,800 | $116,900 |
| 2020 | $949 | $108,200 | $20,800 | $87,400 |
| 2019 | $838 | $102,100 | $20,800 | $81,300 |
| 2018 | $776 | $95,900 | $20,800 | $75,100 |
| 2017 | $729 | $93,100 | $20,800 | $72,300 |
| 2016 | $696 | $90,600 | $21,000 | $69,600 |
| 2014 | $607 | $84,900 | $21,000 | $63,900 |
| 2013 | $640 | $84,900 | $21,000 | $63,900 |
Source: Public Records
Map
Nearby Homes
- 207 Trout Creek Rd
- 205 Twin River Trail
- 305 S Division St
- 501 E Elkhart St
- 00000 County Road 25
- 50773 Terra Ct
- 50766 Terra Ct
- 15042 Luna Ln
- 0 State Line Rd Unit 202502499
- 0 Wigwam Ct Unit 15 & 16
- 0 County Road 8 Rear
- Lot 101 Bayridge Ct Unit 101
- 3608 Bayridge Dr Unit 87
- Lot 98A Bayridge Ct Unit 98A
- 9680 Bayridge Ct Unit 100
- Lot 86A Bayridge Dr Unit 86A
- 3604 Bayridge Dr Unit 89
- 20308 Longboat Ct
- 3600 Bayridge Dr Unit 91
- VL Bayridge Ct
- 606 N Division St Unit 23
- 206 Trout Creek Rd
- 200 Trout Creek Rd
- 508 N Division St
- 211 Trout Creek Rd
- 0 River Road N Lot 1
- 0000 N River Rd
- 0 N River Rd
- 108 Trout Creek Rd
- 700 N Division St
- 700 N Division St Unit 23
- 605 N Division St
- 101 N River Rd
- 5 N River Rd
- 603 Division (Cr 23)
- 603 N Division St
- 704 N Division St Unit 23
- 800 N Division St Unit 23
- 507 N Division St
- 403 Trout Creek Rd