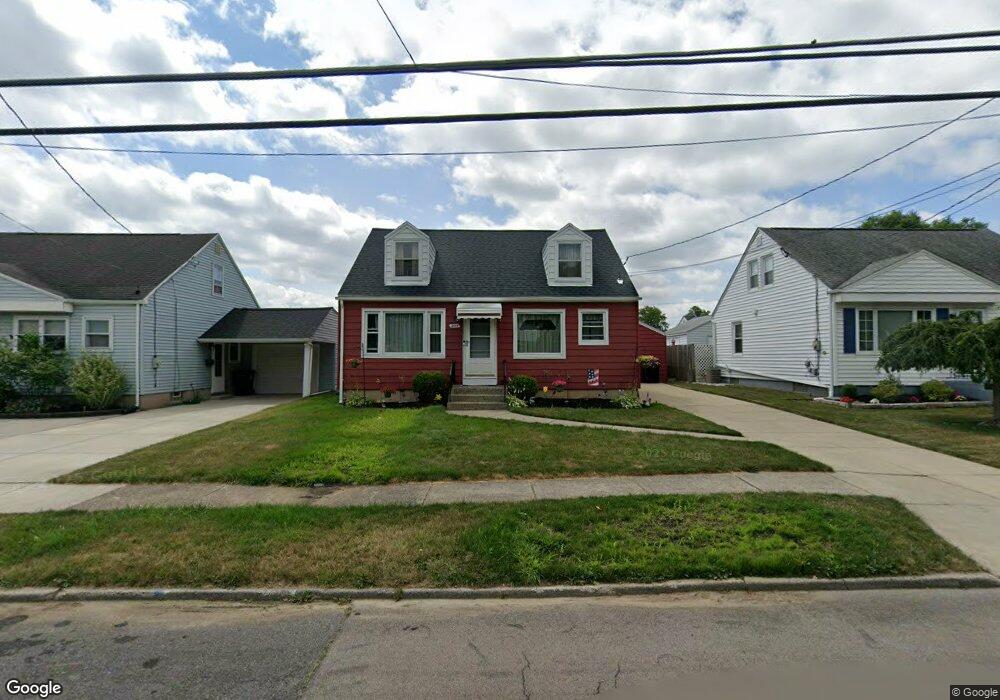
203 Utica St Tonawanda, NY 14150
Estimated Value: $227,000 - $236,662
2
Beds
1
Bath
1,260
Sq Ft
$183/Sq Ft
Est. Value
About This Home
This home is located at 203 Utica St, Tonawanda, NY 14150 and is currently estimated at $231,166, approximately $183 per square foot. 203 Utica St is a home located in Erie County with nearby schools including Mullen Elementary School, Tonawanda Elementary School, and Tonawanda Middle High School.
Ownership History
Date
Name
Owned For
Owner Type
Purchase Details
Closed on
Feb 4, 2021
Sold by
Mittelstaedt Margaret
Bought by
Mittelstaedt Margaret and Sharpe Beverly A
Current Estimated Value
Purchase Details
Closed on
Mar 22, 2005
Sold by
Stahl Lawrence and Stahl Michael
Bought by
Mittelstaedt Margaret
Home Financials for this Owner
Home Financials are based on the most recent Mortgage that was taken out on this home.
Original Mortgage
$49,000
Interest Rate
5.78%
Mortgage Type
Fannie Mae Freddie Mac
Create a Home Valuation Report for This Property
The Home Valuation Report is an in-depth analysis detailing your home's value as well as a comparison with similar homes in the area
Home Values in the Area
Average Home Value in this Area
Purchase History
| Date | Buyer | Sale Price | Title Company |
|---|---|---|---|
| Mittelstaedt Margaret | -- | None Available | |
| Mittelstaedt Margaret | -- | -- |
Source: Public Records
Mortgage History
| Date | Status | Borrower | Loan Amount |
|---|---|---|---|
| Closed | Mittelstaedt Margaret | $49,000 |
Source: Public Records
Tax History Compared to Growth
Tax History
| Year | Tax Paid | Tax Assessment Tax Assessment Total Assessment is a certain percentage of the fair market value that is determined by local assessors to be the total taxable value of land and additions on the property. | Land | Improvement |
|---|---|---|---|---|
| 2024 | $2,508 | $166,000 | $13,300 | $152,700 |
| 2023 | $1,323 | $166,000 | $13,300 | $152,700 |
| 2022 | $2,535 | $114,000 | $14,200 | $99,800 |
| 2021 | $2,526 | $114,000 | $14,200 | $99,800 |
| 2020 | $1,323 | $114,000 | $14,200 | $99,800 |
| 2019 | $2,585 | $114,000 | $14,200 | $99,800 |
| 2018 | $1,354 | $114,000 | $14,200 | $99,800 |
| 2017 | $551 | $91,000 | $13,700 | $77,300 |
| 2016 | $1,013 | $91,000 | $13,700 | $77,300 |
| 2015 | -- | $91,000 | $13,700 | $77,300 |
| 2014 | -- | $91,000 | $13,700 | $77,300 |
Source: Public Records
Map
Nearby Homes