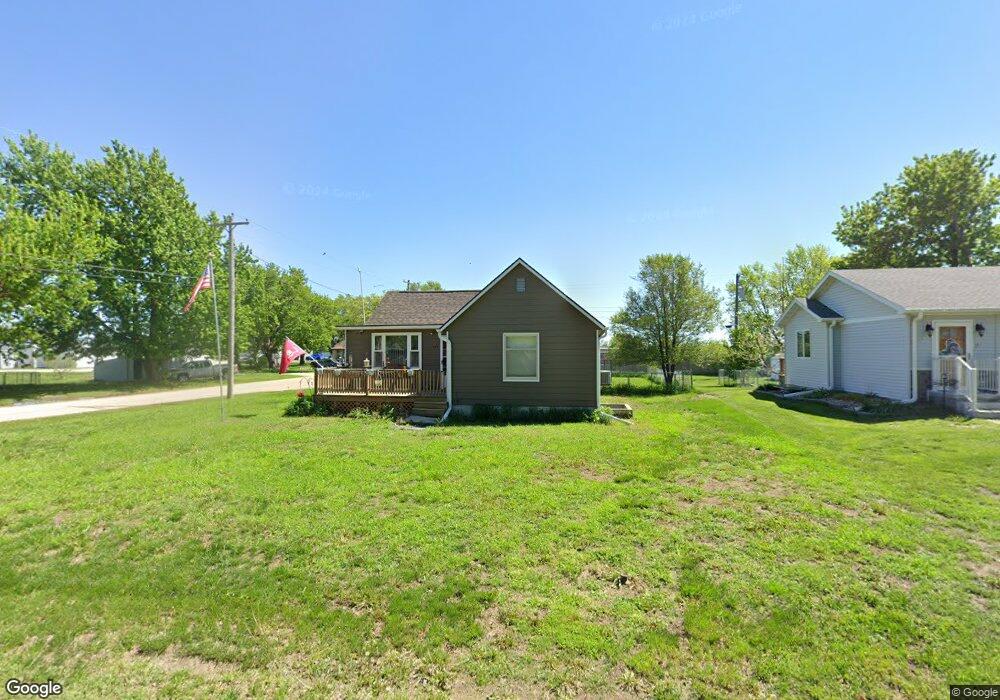
203 W N St Mc Cool Junction, NE 68401
Estimated Value: $161,934 - $303,000
--
Bed
--
Bath
1,344
Sq Ft
$172/Sq Ft
Est. Value
About This Home
This home is located at 203 W N St, Mc Cool Junction, NE 68401 and is currently estimated at $231,734, approximately $172 per square foot. 203 W N St is a home with nearby schools including McCool Junction Elementary School and McCool Junction Junior/Senior High School.
Ownership History
Date
Name
Owned For
Owner Type
Purchase Details
Closed on
Dec 20, 2019
Sold by
Neville Jason B
Bought by
Farley Cari L and Farley Cedric
Current Estimated Value
Home Financials for this Owner
Home Financials are based on the most recent Mortgage that was taken out on this home.
Original Mortgage
$96,960
Outstanding Balance
$85,112
Interest Rate
3.49%
Mortgage Type
FHA
Estimated Equity
$146,622
Purchase Details
Closed on
Jun 28, 2013
Sold by
Barber Jack and Barber Ladeane E
Bought by
Neville Jason B
Purchase Details
Closed on
Jan 21, 2009
Sold by
Mccool Junction Village Of
Bought by
Struebing Wayne and Struebing Mary
Purchase Details
Closed on
Jun 19, 2008
Sold by
Mccool Junction Village Of
Bought by
Green Christopher J and Green Nadine E
Purchase Details
Closed on
Dec 20, 2007
Sold by
Wilcox Est Heirs Of
Bought by
Mccool Junction Village Of
Create a Home Valuation Report for This Property
The Home Valuation Report is an in-depth analysis detailing your home's value as well as a comparison with similar homes in the area
Home Values in the Area
Average Home Value in this Area
Purchase History
| Date | Buyer | Sale Price | Title Company |
|---|---|---|---|
| Farley Cari L | $99,000 | Community Title | |
| Neville Jason B | -- | -- | |
| Struebing Wayne | -- | -- | |
| Green Christopher J | $3,500 | -- | |
| Mccool Junction Village Of | $9,500 | -- |
Source: Public Records
Mortgage History
| Date | Status | Borrower | Loan Amount |
|---|---|---|---|
| Open | Farley Cari L | $96,960 |
Source: Public Records
Tax History Compared to Growth
Tax History
| Year | Tax Paid | Tax Assessment Tax Assessment Total Assessment is a certain percentage of the fair market value that is determined by local assessors to be the total taxable value of land and additions on the property. | Land | Improvement |
|---|---|---|---|---|
| 2024 | $1,354 | $97,978 | $3,150 | $94,828 |
| 2023 | $1,428 | $97,978 | $3,150 | $94,828 |
| 2022 | $1,381 | $95,698 | $3,150 | $92,548 |
| 2021 | $1,293 | $86,863 | $3,150 | $83,713 |
| 2020 | $1,273 | $79,616 | $3,150 | $76,466 |
| 2019 | $1,493 | $79,616 | $3,150 | $76,466 |
| 2018 | $1,480 | $77,582 | $3,150 | $74,432 |
| 2017 | $1,426 | $78,893 | $3,150 | $75,743 |
| 2016 | $1,572 | $84,050 | $2,800 | $81,250 |
| 2015 | $1,420 | $81,302 | $2,800 | $78,502 |
| 2014 | $1,358 | $81,302 | $2,800 | $78,502 |
Source: Public Records
Map
Nearby Homes
- Lot 2 Blk 3 St
- LOT 4 Blk 3 St
- LOT 5 Blk 3 St
- LOT 6 Blk 3 St
- LOT 5 Blk 2 St
- LOT 1 Blk 1 3rd Add St
- Lot 1 Blk 2 St
- Lot 4 Blk 2 St
- LOT 2 Blk 2 St
- 300 Jo Ln
- Lot 10 Blk 1 St
- Lot 3 Blk 2 St
- Lot 4 Blk 1 St
- LOT 9 Blk 1 St
- LOT 5 Blk 1 St
- Lot 8 Blk 1 St
- Lot 6 Blk 1 St
- LOT 7 Blk 1 St
- 501 Road G
- 3120 S Lincoln Ave