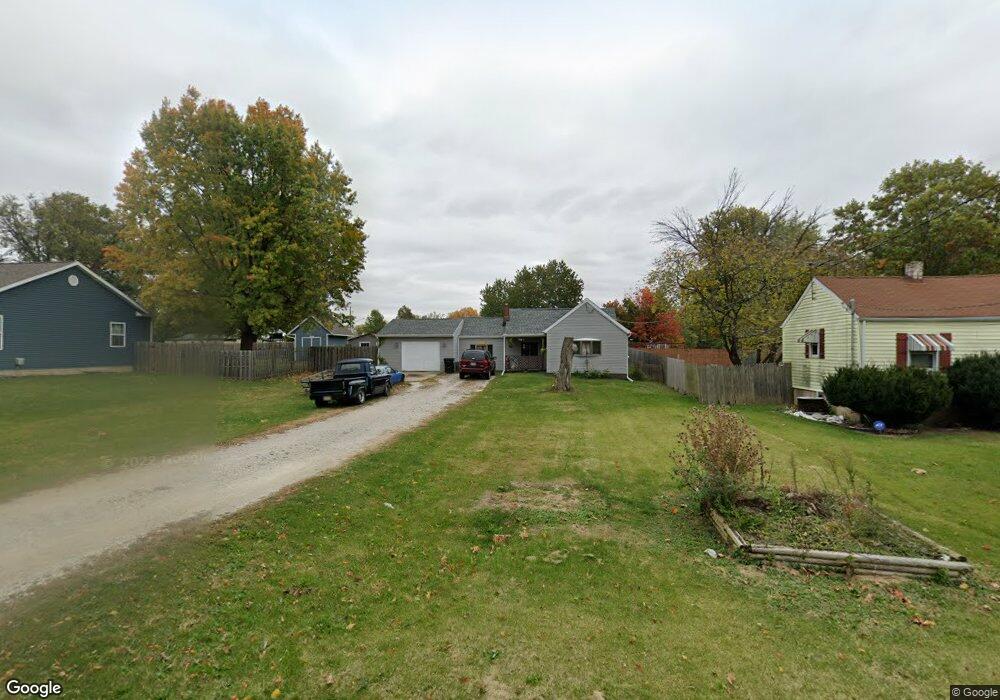
203 Wagner St Washington, IL 61571
Sunnyland NeighborhoodEstimated Value: $104,000 - $125,228
2
Beds
1
Bath
886
Sq Ft
$131/Sq Ft
Est. Value
About This Home
This home is located at 203 Wagner St, Washington, IL 61571 and is currently estimated at $116,307, approximately $131 per square foot. 203 Wagner St is a home located in Tazewell County with nearby schools including J L Hensey Elementary School, Beverly Manor Elementary School, and Washington Community High School.
Ownership History
Date
Name
Owned For
Owner Type
Purchase Details
Closed on
Jul 23, 2010
Sold by
Davis Rennie Joe
Bought by
Baior Mathew A
Current Estimated Value
Home Financials for this Owner
Home Financials are based on the most recent Mortgage that was taken out on this home.
Original Mortgage
$7,000
Interest Rate
4.74%
Mortgage Type
Purchase Money Mortgage
Purchase Details
Closed on
Jul 22, 2010
Sold by
Seckler Sara and Davis Sara Schrock
Bought by
Davis Rennie Joe
Home Financials for this Owner
Home Financials are based on the most recent Mortgage that was taken out on this home.
Original Mortgage
$7,000
Interest Rate
4.74%
Mortgage Type
Purchase Money Mortgage
Purchase Details
Closed on
Aug 11, 2008
Sold by
Davis Wilma L and Davis Rennie Joe
Bought by
Osborn Larissa M and Chandler Lucas B
Home Financials for this Owner
Home Financials are based on the most recent Mortgage that was taken out on this home.
Original Mortgage
$69,507
Interest Rate
6.39%
Mortgage Type
FHA
Create a Home Valuation Report for This Property
The Home Valuation Report is an in-depth analysis detailing your home's value as well as a comparison with similar homes in the area
Home Values in the Area
Average Home Value in this Area
Purchase History
| Date | Buyer | Sale Price | Title Company |
|---|---|---|---|
| Baior Mathew A | $12,500 | Pekin Title Llc | |
| Davis Rennie Joe | -- | Pekin Title Llc | |
| Osborn Larissa M | $70,000 | None Available |
Source: Public Records
Mortgage History
| Date | Status | Borrower | Loan Amount |
|---|---|---|---|
| Closed | Baior Mathew A | $7,000 | |
| Previous Owner | Osborn Larissa M | $69,507 |
Source: Public Records
Tax History Compared to Growth
Tax History
| Year | Tax Paid | Tax Assessment Tax Assessment Total Assessment is a certain percentage of the fair market value that is determined by local assessors to be the total taxable value of land and additions on the property. | Land | Improvement |
|---|---|---|---|---|
| 2024 | $1,968 | $29,110 | $7,290 | $21,820 |
| 2023 | $1,968 | $27,000 | $6,760 | $20,240 |
| 2022 | $1,868 | $25,230 | $6,320 | $18,910 |
| 2021 | $1,788 | $24,610 | $6,160 | $18,450 |
| 2020 | $1,775 | $24,610 | $6,160 | $18,450 |
| 2019 | $1,739 | $24,610 | $6,160 | $18,450 |
| 2018 | $1,706 | $24,610 | $6,160 | $18,450 |
| 2017 | $1,663 | $23,920 | $5,990 | $17,930 |
| 2016 | $1,623 | $23,920 | $5,990 | $17,930 |
| 2015 | $1,578 | $0 | $0 | $0 |
| 2013 | $1,524 | $23,250 | $5,820 | $17,430 |
Source: Public Records
Map
Nearby Homes
- 106 Ernest St Unit A & B
- 503 Velma St
- Lot 14 Sonny Dr
- 2218 Washington Rd
- 103 S Meadowview Ln
- 401 Belaire Dr
- 2447 Centennial Dr
- 1914 Cobblestone
- 405 S Summit Dr
- 114 Smiley Ct
- 115 Smiley Ct
- 607 S Summit Dr
- 232 Briargate Rd
- 1830 Kern Rd
- 100 Scarlet Ct
- 102 Scarlet Ct
- 101 Scarlet Ct
- 103 Scarlet Ct
- 107 Scarlet Ct
- 104 Scarlet Ct