


203 Walnut St Waverly, OH 45690
Estimated payment $1,325/month
Highlights
- Wood Flooring
- 2.5 Car Detached Garage
- Living Room
- Covered Patio or Porch
- Storm Windows
- 4-minute walk to Canal Park
About This Home
Recent updates on this lovely home conveniently located in the heart of Waverly. Just a quick jaunt to shopping, restaurants, schools, and more. Spacious rooms throughout. 35 x 26 detached garage in the back with room for an office. Fenced-in backyard with a large patio. Great for entertaining, kids, and pets. Covered front porch nice for relaxing. Large room in the back could be divided into a 4th BR if necessary.
Listing Agent
Todd Harris Realty Brokerage Phone: 7409477677 License #2004003727 Listed on: 12/04/2025
Home Details
Home Type
- Single Family
Est. Annual Taxes
- $1,257
Year Built
- Built in 1951
Lot Details
- 9,450 Sq Ft Lot
- Fenced
Parking
- 2.5 Car Detached Garage
Home Design
- Rubber Roof
- Metal Roof
- Wood Siding
Interior Spaces
- 1,812 Sq Ft Home
- 1-Story Property
- Ceiling Fan
- Wood Burning Fireplace
- Living Room
- Dining Room
- Storm Windows
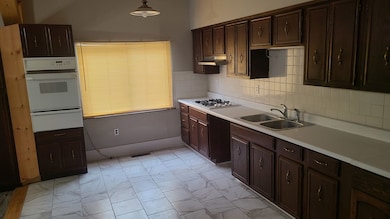
Kitchen
- Oven
- Built-In Range
- Microwave
Flooring
- Wood
- Carpet
- Ceramic Tile
- Vinyl Plank
Bedrooms and Bathrooms
- 3 Main Level Bedrooms
- Bathroom on Main Level
Outdoor Features
- Covered Patio or Porch
Schools
- Waverly Csd Elementary And Middle School
- Waverly Csd High School
Utilities
- Forced Air Heating and Cooling System
- Heating System Uses Natural Gas
- Electric Water Heater
- Cable TV Available
Listing and Financial Details
- Assessor Parcel Number 18157600
Map
Home Values in the Area
Average Home Value in this Area
Tax History
| Year | Tax Paid | Tax Assessment Tax Assessment Total Assessment is a certain percentage of the fair market value that is determined by local assessors to be the total taxable value of land and additions on the property. | Land | Improvement |
|---|---|---|---|---|
| 2024 | $1,257 | $35,510 | $9,790 | $25,720 |
| 2023 | $1,257 | $35,510 | $9,790 | $25,720 |
| 2022 | $1,084 | $26,570 | $6,990 | $19,580 |
| 2021 | $1,064 | $26,570 | $6,990 | $19,580 |
| 2020 | $1,064 | $26,570 | $6,990 | $19,580 |
| 2019 | $908 | $22,530 | $5,930 | $16,600 |
| 2018 | $950 | $22,530 | $5,930 | $16,600 |
| 2017 | $940 | $22,530 | $5,930 | $16,600 |
| 2016 | $986 | $23,900 | $5,690 | $18,210 |
| 2015 | $986 | $23,900 | $5,690 | $18,210 |
| 2014 | $954 | $23,900 | $5,690 | $18,210 |
| 2013 | $967 | $23,900 | $5,690 | $18,210 |
| 2012 | $990 | $23,900 | $5,690 | $18,210 |
Property History
| Date | Event | Price | List to Sale | Price per Sq Ft |
|---|---|---|---|---|
| 01/05/2026 01/05/26 | Price Changed | $234,900 | -2.1% | $130 / Sq Ft |
| 12/04/2025 12/04/25 | For Sale | $239,900 | -- | $132 / Sq Ft |
Purchase History
| Date | Type | Sale Price | Title Company |
|---|---|---|---|
| Sheriffs Deed | $120,750 | None Listed On Document | |
| Warranty Deed | $63,000 | None Available | |
| Warranty Deed | $16,500 | None Available |
Mortgage History
| Date | Status | Loan Amount | Loan Type |
|---|---|---|---|
| Previous Owner | $61,858 | FHA |
Source: Scioto Valley REALTORS®
MLS Number: 198955
APN: 18-157600.0000
- 1123 Oh-552
- 703-709 West St
- 495 Brookside Dr Unit A
- 1162 Rapp-Hollow Rd Unit 1
- 547 Plyleys Ln
- 102 Walnut Hills Dr
- 596 W 5th St
- 402 W Main St
- 98 W Main St Unit 1
- 241 W Water St Unit ID1265609P
- 241 W Water St Unit ID1265644P
- 241 W Water St Unit ID1265607P
- 147 Scioto Ave Unit 147
- 1355 Western Ave
- 478 Arch St Unit 215
- 176 Hirn St
- 767 Hopetown Rd
- 77 Morgan Dr
- 15 Orchard Ln
- 440 N Main St
