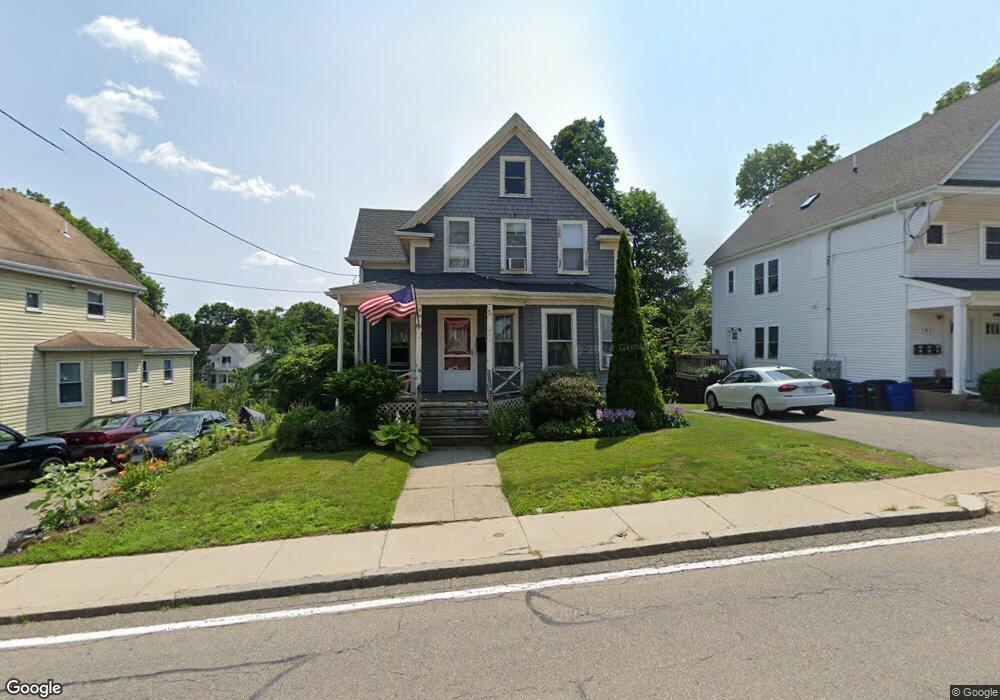
203 Whitwell St Quincy, MA 02169
Quincy Center NeighborhoodEstimated Value: $630,000 - $745,000
3
Beds
1
Bath
1,373
Sq Ft
$497/Sq Ft
Est. Value
About This Home
This home is located at 203 Whitwell St, Quincy, MA 02169 and is currently estimated at $682,479, approximately $497 per square foot. 203 Whitwell St is a home located in Norfolk County with nearby schools including Charles A. Bernazzani Elementary School, Central Middle School, and Quincy High School.
Ownership History
Date
Name
Owned For
Owner Type
Purchase Details
Closed on
Jun 30, 1998
Sold by
Johnson Exr Mary A
Bought by
Donahue Cynthia J
Current Estimated Value
Home Financials for this Owner
Home Financials are based on the most recent Mortgage that was taken out on this home.
Original Mortgage
$116,375
Outstanding Balance
$24,002
Interest Rate
7.09%
Mortgage Type
Purchase Money Mortgage
Estimated Equity
$658,477
Create a Home Valuation Report for This Property
The Home Valuation Report is an in-depth analysis detailing your home's value as well as a comparison with similar homes in the area
Home Values in the Area
Average Home Value in this Area
Purchase History
| Date | Buyer | Sale Price | Title Company |
|---|---|---|---|
| Donahue Cynthia J | $122,500 | -- |
Source: Public Records
Mortgage History
| Date | Status | Borrower | Loan Amount |
|---|---|---|---|
| Open | Donahue Cynthia J | $116,375 |
Source: Public Records
Tax History Compared to Growth
Tax History
| Year | Tax Paid | Tax Assessment Tax Assessment Total Assessment is a certain percentage of the fair market value that is determined by local assessors to be the total taxable value of land and additions on the property. | Land | Improvement |
|---|---|---|---|---|
| 2025 | $6,021 | $522,200 | $282,600 | $239,600 |
| 2024 | $5,628 | $499,400 | $269,200 | $230,200 |
| 2023 | $5,148 | $462,500 | $244,700 | $217,800 |
| 2022 | $5,245 | $437,800 | $222,500 | $215,300 |
| 2021 | $5,008 | $412,500 | $222,500 | $190,000 |
| 2020 | $4,907 | $394,800 | $211,900 | $182,900 |
| 2019 | $4,765 | $379,700 | $199,900 | $179,800 |
| 2018 | $4,824 | $361,600 | $199,900 | $161,700 |
| 2017 | $4,818 | $340,000 | $190,400 | $149,600 |
| 2016 | $4,598 | $320,200 | $181,300 | $138,900 |
| 2015 | $4,498 | $308,100 | $181,300 | $126,800 |
| 2014 | $4,275 | $287,700 | $172,600 | $115,100 |
Source: Public Records
Map
Nearby Homes
- 73 Cranch St Unit 73
- 73 Scotch Pond Place
- 118 Dimmock St
- 293 Whitwell St
- 195 Thomas Burgin Pkwy Unit 205
- 165 Granite St
- 215 Thomas Burgin Pkwy Unit 35
- 1 Cityview Ln Unit 204
- 1 Cityview Ln Unit 506
- 25 Carrolls Ln
- 46 Suomi Rd
- 46 Suomi Rd Unit 46
- 312 Adams St
- 18 Cliveden St Unit 201W
- 94 Brook Rd Unit 3
- 77 Adams St Unit 610
- 2 Cliveden St Unit 601E
- 2 Cliveden St Unit 305E
- 20 Whitney Rd
- 20 Whitney Rd Unit 307
- 207 Whitwell St
- 207 Whitwell St Unit 2
- 195 Whitwell St
- 62 Cranch St
- 64 Cranch St Unit 64-3
- 62 Cranch St
- 62 Cranch St Unit 62
- 62 Cranch St Unit 2
- 62 Cranch St Unit 1
- 58 Cranch St
- 66 Cranch St
- 193 Whitwell St
- 211 Whitwell St
- 202 Whitwell St
- 202 Whitwell St
- 202 Whitwell St Unit 202
- 56 Cranch St Unit 3
- 54 Cranch St
- 54 Cranch St Unit 1
- 54 Cranch St Unit 2