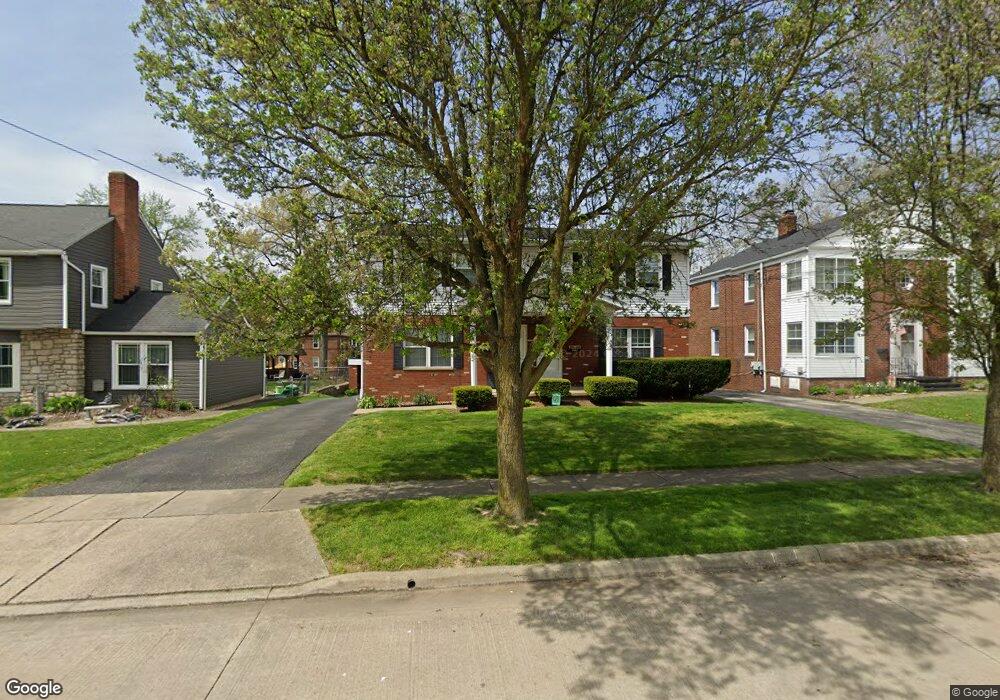
2030 11th St Unit 2032 Cuyahoga Falls, OH 44221
Broad Boulevard NeighborhoodEstimated Value: $263,000 - $281,062
4
Beds
2
Baths
2,320
Sq Ft
$117/Sq Ft
Est. Value
About This Home
This home is located at 2030 11th St Unit 2032, Cuyahoga Falls, OH 44221 and is currently estimated at $271,516, approximately $117 per square foot. 2030 11th St Unit 2032 is a home located in Summit County with nearby schools including Dewitt Elementary School, Bolich Middle School, and Cuyahoga Falls High School.
Ownership History
Date
Name
Owned For
Owner Type
Purchase Details
Closed on
Aug 28, 2025
Sold by
Truman Tony A
Bought by
Tony A Truman Revocable Living Trust and Truman
Current Estimated Value
Purchase Details
Closed on
Sep 29, 2007
Sold by
Milan Robert D
Bought by
Truman Tony A
Home Financials for this Owner
Home Financials are based on the most recent Mortgage that was taken out on this home.
Original Mortgage
$132,560
Interest Rate
6.66%
Mortgage Type
Purchase Money Mortgage
Create a Home Valuation Report for This Property
The Home Valuation Report is an in-depth analysis detailing your home's value as well as a comparison with similar homes in the area
Home Values in the Area
Average Home Value in this Area
Purchase History
| Date | Buyer | Sale Price | Title Company |
|---|---|---|---|
| Tony A Truman Revocable Living Trust | -- | None Listed On Document | |
| Truman Tony A | $165,700 | Real Living Title Agency Ltd |
Source: Public Records
Mortgage History
| Date | Status | Borrower | Loan Amount |
|---|---|---|---|
| Previous Owner | Truman Tony A | $132,560 |
Source: Public Records
Tax History Compared to Growth
Tax History
| Year | Tax Paid | Tax Assessment Tax Assessment Total Assessment is a certain percentage of the fair market value that is determined by local assessors to be the total taxable value of land and additions on the property. | Land | Improvement |
|---|---|---|---|---|
| 2025 | $4,243 | $76,846 | $12,467 | $64,379 |
| 2024 | $4,243 | $76,846 | $12,467 | $64,379 |
| 2023 | $4,243 | $76,846 | $12,467 | $64,379 |
| 2022 | $4,347 | $63,995 | $10,301 | $53,694 |
| 2021 | $4,347 | $63,995 | $10,301 | $53,694 |
| 2020 | $4,278 | $63,990 | $10,300 | $53,690 |
| 2019 | $3,985 | $54,300 | $9,490 | $44,810 |
| 2018 | $3,397 | $54,300 | $9,490 | $44,810 |
| 2017 | $3,095 | $54,300 | $9,490 | $44,810 |
| 2016 | $3,098 | $50,040 | $9,490 | $40,550 |
| 2015 | $3,095 | $50,040 | $9,490 | $40,550 |
| 2014 | $3,105 | $50,180 | $9,630 | $40,550 |
| 2013 | $3,112 | $51,560 | $9,630 | $41,930 |
Source: Public Records
Map
Nearby Homes