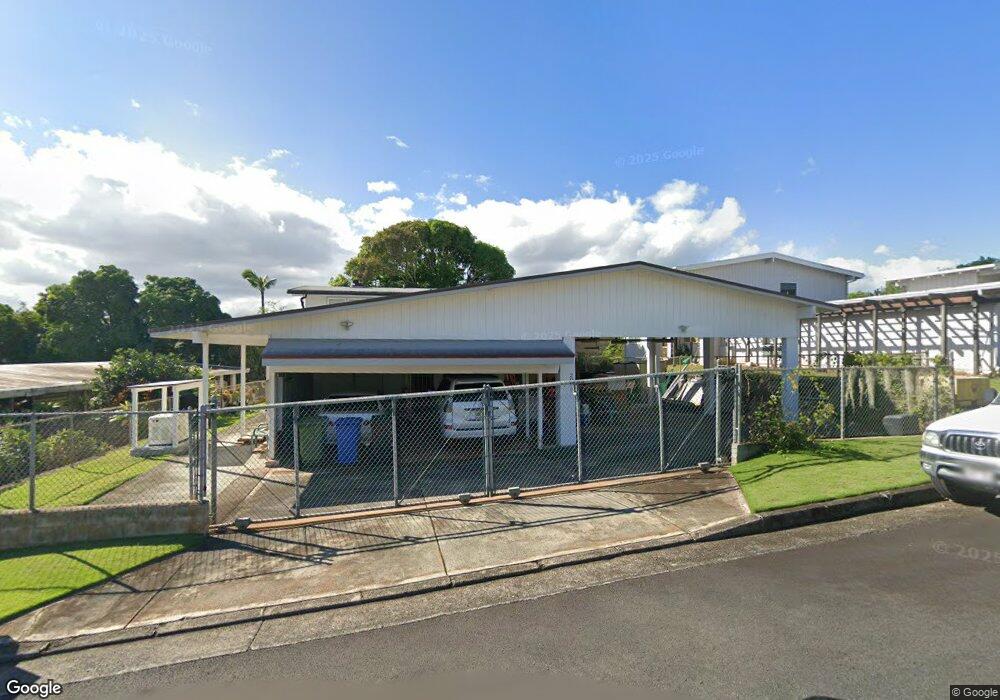
2030 Aaniu Loop Pearl City, HI 96782
Estimated Value: $1,196,000 - $1,249,000
3
Beds
3
Baths
2,912
Sq Ft
$424/Sq Ft
Est. Value
About This Home
This home is located at 2030 Aaniu Loop, Pearl City, HI 96782 and is currently estimated at $1,233,861, approximately $423 per square foot. 2030 Aaniu Loop is a home located in Honolulu County with nearby schools including Palisades Elementary School, Highlands Intermediate School, and Pearl City High School.
Ownership History
Date
Name
Owned For
Owner Type
Purchase Details
Closed on
Nov 3, 2020
Sold by
Fukuhara Kent A and Fukuhara Kayleen K
Bought by
Fukuhara Kent A and Fukuhara Kayleen K
Current Estimated Value
Purchase Details
Closed on
Jun 30, 2004
Sold by
Fukuhara Kent A
Bought by
Fukuhara Kent A and Fukuhara Kayleen K
Purchase Details
Closed on
Aug 29, 2003
Sold by
Rice Carl Thomas and Rice Jeraldine Helen
Bought by
Fukuhara Kent A
Home Financials for this Owner
Home Financials are based on the most recent Mortgage that was taken out on this home.
Original Mortgage
$384,000
Outstanding Balance
$175,929
Interest Rate
6.06%
Mortgage Type
Unknown
Estimated Equity
$1,057,932
Purchase Details
Closed on
Dec 13, 2001
Sold by
Rice Jeraldine Helen and Vincent Elaine Mae
Bought by
Rice Carl Thomas and Rice Jeraldine Helen
Home Financials for this Owner
Home Financials are based on the most recent Mortgage that was taken out on this home.
Original Mortgage
$140,000
Interest Rate
6.39%
Create a Home Valuation Report for This Property
The Home Valuation Report is an in-depth analysis detailing your home's value as well as a comparison with similar homes in the area
Home Values in the Area
Average Home Value in this Area
Purchase History
| Date | Buyer | Sale Price | Title Company |
|---|---|---|---|
| Fukuhara Kent A | -- | None Available | |
| Fukuhara Kent A | -- | None Available | |
| Fukuhara Kent A | -- | None Available | |
| Fukuhara Kent A | -- | -- | |
| Fukuhara Kent A | $480,000 | -- | |
| Rice Carl Thomas | -- | -- |
Source: Public Records
Mortgage History
| Date | Status | Borrower | Loan Amount |
|---|---|---|---|
| Open | Fukuhara Kent A | $384,000 | |
| Previous Owner | Rice Carl Thomas | $140,000 | |
| Closed | Fukuhara Kent A | $72,000 |
Source: Public Records
Tax History Compared to Growth
Tax History
| Year | Tax Paid | Tax Assessment Tax Assessment Total Assessment is a certain percentage of the fair market value that is determined by local assessors to be the total taxable value of land and additions on the property. | Land | Improvement |
|---|---|---|---|---|
| 2025 | $3,679 | $1,157,500 | $743,300 | $414,200 |
| 2024 | $3,679 | $1,211,100 | $769,900 | $441,200 |
| 2023 | $3,039 | $1,068,200 | $769,900 | $298,300 |
| 2022 | $3,201 | $1,014,700 | $690,200 | $324,500 |
| 2021 | $3,002 | $957,800 | $584,100 | $373,700 |
| 2020 | $2,978 | $950,900 | $605,300 | $345,600 |
| 2019 | $2,949 | $922,500 | $584,100 | $338,400 |
| 2018 | $2,677 | $844,800 | $578,700 | $266,100 |
| 2017 | $2,453 | $780,900 | $499,100 | $281,800 |
| 2016 | $2,462 | $783,400 | $446,000 | $337,400 |
| 2015 | $2,402 | $766,300 | $408,900 | $357,400 |
| 2014 | $2,251 | $729,000 | $371,700 | $357,300 |
Source: Public Records
Map
Nearby Homes
- 2093 Aaniu Loop
- 2078 Akaikai Loop
- 2131 Auhuhu St
- 2160 Aamanu St
- 1052 Maiha Cir
- 1768 Hoohai St
- 2222 Apoepoe St
- 1638 Makamua St
- 2274 Aamanu St
- 1858 Hoolehua St
- 1519 Maluawai St
- 2342 Ahapule St
- 1375 Komo Mai Dr
- 1485 Kaumoli St
- 2306 Komo Mai Dr
- 2310 Apoepoe St
- 910 Makamua Place
- 1579 Hoonipo St
- 1526 Hooli Cir
- 1528 Hooli Cir
- 2032 Aaniu Loop
- 2028 Aaniu Loop
- 2036 Aaniu Loop
- 2026 Aaniu Loop
- 2029 Aaniu Loop
- 2031 Aaniu Loop
- 2025 Aaniu Loop
- 2038 Aaniu Loop
- 2019 Aaniu Loop
- 2024 Aaniu Loop
- 2037 Aaniu Loop
- 2045 Aaniu Place
- 2022 Aaniu Loop
- 2040 Aaniu Loop
- 2041 Aaniu Loop
- 2015 Aaniu Loop
- 2047 Aaniu Place
- 2020 Aaniu Loop
- 2042 Aaniu Loop
- 2008 Aamomi St