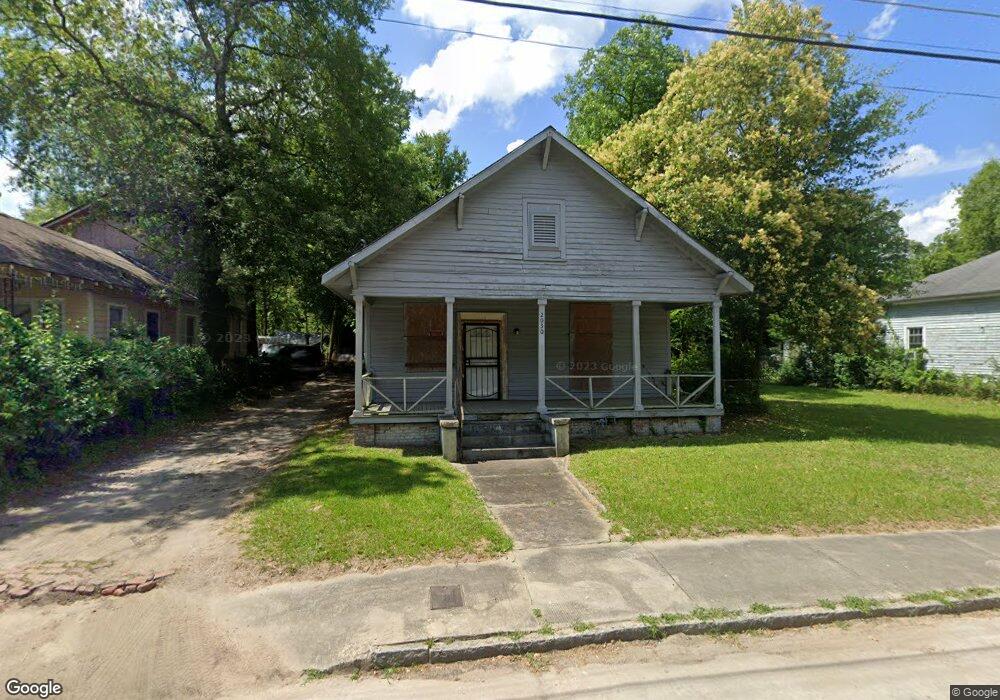
2030 Beech Ave Macon, GA 31204
Napier Heights Historic District NeighborhoodEstimated Value: $45,000 - $77,000
2
Beds
1
Bath
1,184
Sq Ft
$49/Sq Ft
Est. Value
About This Home
This home is located at 2030 Beech Ave, Macon, GA 31204 and is currently estimated at $58,227, approximately $49 per square foot. 2030 Beech Ave is a home located in Bibb County with nearby schools including Williams Elementary School, Miller Fine Arts Magnet Middle School, and Central High School.
Ownership History
Date
Name
Owned For
Owner Type
Purchase Details
Closed on
Dec 20, 2011
Sold by
Accele Properties Inc
Bought by
Moore Frederick
Current Estimated Value
Purchase Details
Closed on
Jun 30, 2011
Sold by
White Ronnie
Bought by
Accele Properties Inc
Purchase Details
Closed on
Nov 10, 2010
Sold by
Accele Properties Inc
Bought by
White Ronnie
Home Financials for this Owner
Home Financials are based on the most recent Mortgage that was taken out on this home.
Original Mortgage
$29,000
Interest Rate
4.33%
Mortgage Type
Seller Take Back
Purchase Details
Closed on
May 24, 2010
Sold by
First Covenant Bank
Bought by
Accele Properties Inc
Purchase Details
Closed on
Aug 5, 2008
Sold by
Hughes Sharon
Bought by
First Covenant Bank
Purchase Details
Closed on
Dec 12, 2002
Bought by
Hughes Sharon
Purchase Details
Closed on
Nov 1, 2002
Purchase Details
Closed on
Sep 19, 2002
Create a Home Valuation Report for This Property
The Home Valuation Report is an in-depth analysis detailing your home's value as well as a comparison with similar homes in the area
Home Values in the Area
Average Home Value in this Area
Purchase History
| Date | Buyer | Sale Price | Title Company |
|---|---|---|---|
| Moore Frederick | $2,000 | None Available | |
| Accele Properties Inc | -- | None Available | |
| White Ronnie | $30,000 | None Available | |
| Accele Properties Inc | $4,995 | None Available | |
| First Covenant Bank | $57,700 | -- | |
| First Covenant Bank | $60,000 | None Available | |
| Hughes Sharon | $60,000 | -- | |
| -- | $12,000 | -- | |
| -- | $3,000 | -- |
Source: Public Records
Mortgage History
| Date | Status | Borrower | Loan Amount |
|---|---|---|---|
| Previous Owner | White Ronnie | $29,000 |
Source: Public Records
Tax History
| Year | Tax Paid | Tax Assessment Tax Assessment Total Assessment is a certain percentage of the fair market value that is determined by local assessors to be the total taxable value of land and additions on the property. | Land | Improvement |
|---|---|---|---|---|
| 2025 | $154 | $6,250 | $2,160 | $4,090 |
| 2024 | $145 | $5,690 | $1,600 | $4,090 |
| 2023 | $145 | $5,690 | $1,600 | $4,090 |
| 2022 | $101 | $2,930 | $1,638 | $1,292 |
| 2021 | $99 | $2,604 | $1,560 | $1,044 |
| 2020 | $80 | $2,056 | $1,404 | $652 |
| 2019 | $112 | $2,865 | $1,560 | $1,305 |
| 2018 | $352 | $2,865 | $1,560 | $1,305 |
| 2017 | $156 | $4,169 | $1,560 | $2,609 |
| 2016 | $144 | $4,170 | $1,560 | $2,609 |
| 2015 | $204 | $4,170 | $1,560 | $2,609 |
| 2014 | $235 | $4,170 | $1,560 | $2,609 |
Source: Public Records
Map
Nearby Homes
- 1890 Coleman Ave
- 1851 Coleman Ave
- 1925 Napier Ave
- 1195 Lawton Dr
- 1185 Carling Ave
- 1687 Lawton Ave
- 1661 Lawton Ave
- 1909 Dannenberg Ave
- 2334 Napier Ave
- 2372 Beech Ave
- 2380 Napier Ave
- 1495 Ninadel Dr
- 2175 Winship St
- 272 Beverly Place
- 1290 Pio Nono Ave
- 1285 Pio Nono Ave
- 1282 Courtland Ave
- 1342 Ross St
- 1825 Hardeman Ave
- 107 Ward St
Your Personal Tour Guide
Ask me questions while you tour the home.