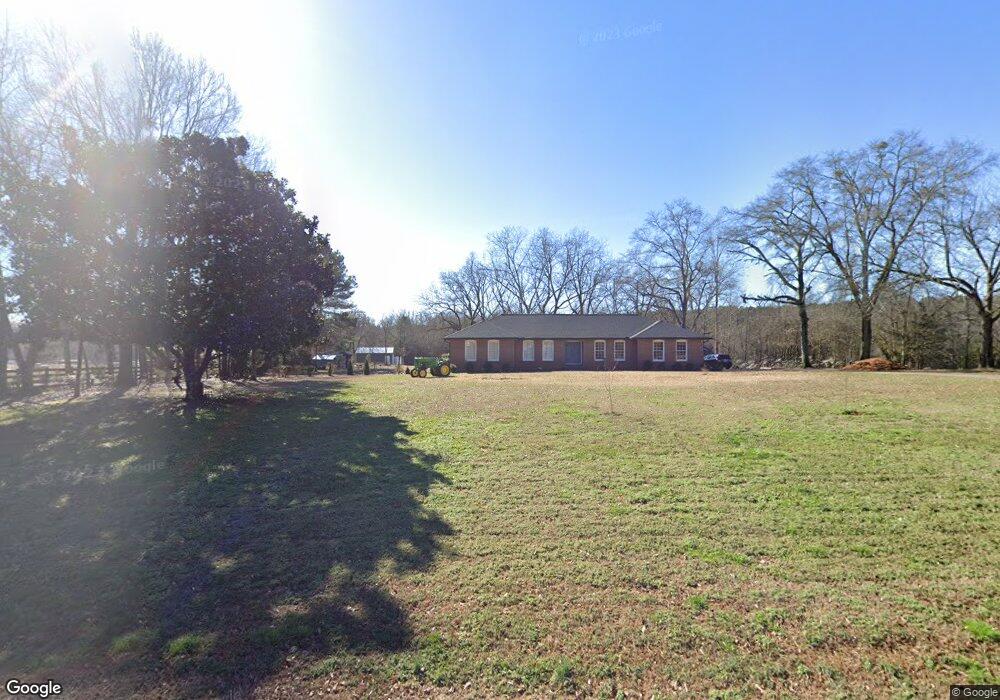
2030 Lipscomb Rd Social Circle, GA 30025
Estimated Value: $368,744 - $389,000
--
Bed
1
Bath
2,181
Sq Ft
$172/Sq Ft
Est. Value
About This Home
This home is located at 2030 Lipscomb Rd, Social Circle, GA 30025 and is currently estimated at $376,186, approximately $172 per square foot. 2030 Lipscomb Rd is a home located in Walton County with nearby schools including Harmony Elementary School, Carver Middle School, and Monroe Area High School.
Ownership History
Date
Name
Owned For
Owner Type
Purchase Details
Closed on
May 30, 2019
Sold by
Whitley Matthew Daniel
Bought by
Young Ann and Young David A
Current Estimated Value
Home Financials for this Owner
Home Financials are based on the most recent Mortgage that was taken out on this home.
Original Mortgage
$183,870
Outstanding Balance
$161,667
Interest Rate
4.1%
Estimated Equity
$214,519
Purchase Details
Closed on
Dec 7, 2018
Sold by
Whitley Milton Allen
Bought by
Whitley Matthew Daniel
Purchase Details
Closed on
Jun 15, 2018
Sold by
Whitley Steven Edward
Bought by
Willis Michael A and Willis Kristin K
Purchase Details
Closed on
Dec 18, 2007
Sold by
Whitley Milton A and Whitley Bruce A
Bought by
Whitley Steven E
Purchase Details
Closed on
Dec 17, 2007
Sold by
Whitley Milton A
Bought by
Whitley Milton A and Whitley Bruce A
Purchase Details
Closed on
Jan 18, 2005
Sold by
Whitley Milton
Bought by
Whitley Steven
Create a Home Valuation Report for This Property
The Home Valuation Report is an in-depth analysis detailing your home's value as well as a comparison with similar homes in the area
Home Values in the Area
Average Home Value in this Area
Purchase History
| Date | Buyer | Sale Price | Title Company |
|---|---|---|---|
| Young Ann | $180,000 | -- | |
| Whitley Matthew Daniel | $160,000 | -- | |
| Whitley Milton Allen | $200,000 | -- | |
| Willis Michael A | $55,000 | -- | |
| Whitley Steven E | -- | -- | |
| Whitley Milton A | -- | -- | |
| Whitley Steven | $30,700 | -- |
Source: Public Records
Mortgage History
| Date | Status | Borrower | Loan Amount |
|---|---|---|---|
| Open | Young Ann | $183,870 |
Source: Public Records
Tax History Compared to Growth
Tax History
| Year | Tax Paid | Tax Assessment Tax Assessment Total Assessment is a certain percentage of the fair market value that is determined by local assessors to be the total taxable value of land and additions on the property. | Land | Improvement |
|---|---|---|---|---|
| 2024 | $3,150 | $114,312 | $30,480 | $83,832 |
| 2023 | $3,134 | $103,312 | $24,720 | $78,592 |
| 2022 | $2,814 | $88,992 | $21,840 | $67,152 |
| 2021 | $2,437 | $74,792 | $16,120 | $58,672 |
| 2020 | $2,373 | $71,032 | $13,640 | $57,392 |
| 2019 | $2,225 | $64,792 | $11,880 | $52,912 |
| 2018 | $2,167 | $64,792 | $11,880 | $52,912 |
| 2017 | $2,183 | $63,352 | $11,880 | $51,472 |
| 2016 | $645 | $52,832 | $9,280 | $43,552 |
| 2015 | $1,753 | $50,792 | $9,280 | $41,512 |
| 2014 | $1,792 | $50,656 | $8,040 | $42,616 |
Source: Public Records
Map
Nearby Homes
- 247 Highway 11
- 259 Georgia 11
- 1526 N Cherokee Rd
- 0 Social Circle Fairplay Rd Unit 7662271
- 0 Social Circle Fairplay Rd Unit 10620284
- 1371 Lipscomb Rd
- 539 Meadows Ln
- 2560 Whitney Rd SE
- 1302 N Cherokee Rd
- 376 Highway 11 SW
- 2781 Mount Paran Church Rd
- 684 N Cherokee Rd
- 690 Park Place Way
- 695 Park Place Way
- 1007 Towne Cir
- 960 Park Place St
- 960 Park Place St Unit 120
- 487 N Cherokee Rd
- 2030 Lipscomb Rd
- 2011 Lipscomb Rd
- 1995 Lipscomb Rd
- 1995 Lipscomb Rd
- 1995 Lipscomb Rd
- 1995 Lipscomb Rd Unit 5
- 2090 Lipscomb Rd
- 2120 Lipscomb Rd
- 161 Highway 11
- 1950 Lipscomb Rd
- 1955 Lipscomb Rd
- 1925 Lipscomb Rd
- 1277 Grady Lemonds Rd
- 1170 Simmons Rd
- 1900 Lipscomb Rd
- 1301 Simmons Rd
- 1840 Lipscomb Rd
- 1281 Simmons Rd
- 1237 Grady Lemonds Rd
- 1237 Grady Lemonds Rd