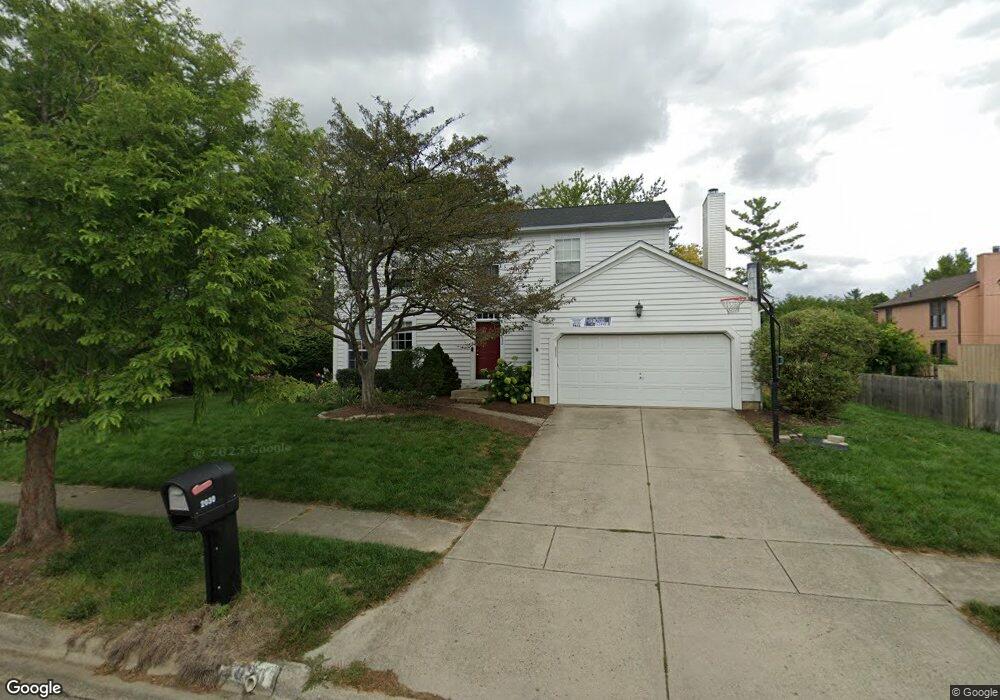
2030 Stancrest Rd Dublin, OH 43016
Olde Sawmill NeighborhoodEstimated Value: $457,000 - $487,000
4
Beds
3
Baths
2,144
Sq Ft
$220/Sq Ft
Est. Value
About This Home
This home is located at 2030 Stancrest Rd, Dublin, OH 43016 and is currently estimated at $472,681, approximately $220 per square foot. 2030 Stancrest Rd is a home located in Franklin County with nearby schools including Granby Elementary School, McCord Middle School, and Worthington Kilbourne High School.
Ownership History
Date
Name
Owned For
Owner Type
Purchase Details
Closed on
May 24, 2010
Sold by
Zhu Xi and Chuang Zhu Dina W
Bought by
Sterenberg Jonathan P and Sterenberg Mary C
Current Estimated Value
Home Financials for this Owner
Home Financials are based on the most recent Mortgage that was taken out on this home.
Original Mortgage
$178,500
Outstanding Balance
$120,051
Interest Rate
5.12%
Mortgage Type
Purchase Money Mortgage
Estimated Equity
$352,630
Purchase Details
Closed on
Mar 28, 1998
Sold by
Gebhardt Mark S and Gebhardt Marilyn J
Bought by
Zhu Xi and Chuang Zhu Dina W
Home Financials for this Owner
Home Financials are based on the most recent Mortgage that was taken out on this home.
Original Mortgage
$123,700
Interest Rate
7.25%
Purchase Details
Closed on
Jul 16, 1993
Purchase Details
Closed on
Dec 16, 1987
Create a Home Valuation Report for This Property
The Home Valuation Report is an in-depth analysis detailing your home's value as well as a comparison with similar homes in the area
Home Values in the Area
Average Home Value in this Area
Purchase History
| Date | Buyer | Sale Price | Title Company |
|---|---|---|---|
| Sterenberg Jonathan P | $210,000 | None Available | |
| Zhu Xi | $163,700 | Celtic Title Agency Inc | |
| -- | $138,500 | -- | |
| -- | $115,600 | -- |
Source: Public Records
Mortgage History
| Date | Status | Borrower | Loan Amount |
|---|---|---|---|
| Open | Sterenberg Jonathan P | $178,500 | |
| Previous Owner | Zhu Xi | $123,700 |
Source: Public Records
Tax History Compared to Growth
Tax History
| Year | Tax Paid | Tax Assessment Tax Assessment Total Assessment is a certain percentage of the fair market value that is determined by local assessors to be the total taxable value of land and additions on the property. | Land | Improvement |
|---|---|---|---|---|
| 2024 | $7,914 | $128,910 | $40,150 | $88,760 |
| 2023 | $7,568 | $128,905 | $40,145 | $88,760 |
| 2022 | $7,091 | $95,840 | $21,250 | $74,590 |
| 2021 | $6,542 | $95,840 | $21,250 | $74,590 |
| 2020 | $6,301 | $95,840 | $21,250 | $74,590 |
| 2019 | $5,866 | $80,510 | $17,680 | $62,830 |
| 2018 | $5,325 | $80,510 | $17,680 | $62,830 |
| 2017 | $5,257 | $80,510 | $17,680 | $62,830 |
| 2016 | $4,966 | $69,940 | $18,800 | $51,140 |
| 2015 | $4,966 | $69,940 | $18,800 | $51,140 |
| 2014 | $4,965 | $69,940 | $18,800 | $51,140 |
| 2013 | $2,470 | $69,930 | $18,795 | $51,135 |
Source: Public Records
Map
Nearby Homes
- 8048 Smoky Row Rd Unit 50
- 2143 Sutter Pkwy
- 2074 Hard Rd
- 1908 Lost Valley Rd
- 2120 Sharwood Ct
- 7898 Sarahurst Dr
- 2280 Saberly Ct
- 8345 Smoky Row Rd Unit 8345
- 8205 Longhorn Rd
- 2220 Surreygate Dr
- 8266 Waco Ln
- 2423 Sutter Pkwy
- 1949 Hamrock Dr
- 7607-7609 Penwood Place
- 2228 Gnarled Pine Dr
- 2469 Sandstrom Dr
- 2462 Sanford Dr
- 2392 Dunsworth Dr
- 1827 Watertower Dr Unit 1827
- 1825 Watertower Dr Unit 1825
- 2036 Stancrest Rd
- 7601 Stanwick Ct
- 7613 Stanwick Ct
- 7649 Stanwick Ct
- 7655 Stanwick Ct
- 7637 Stanwick Ct
- 2042 Stancrest Rd
- 2035 Stancrest Rd
- 7625 Stanwick Ct
- 2023 Stancrest Rd
- 2041 Stancrest Rd
- 7663 Stanwick Ct
- 7590 Stanwick Ct
- 2080 Surrywood Dr
- 2017 Stancrest Rd
- 2047 Stancrest Rd
- 7598 Stanwick Ct
- 2057 Swansford Dr
- 2049 Swansford Dr
- 7604 Stanwick Ct