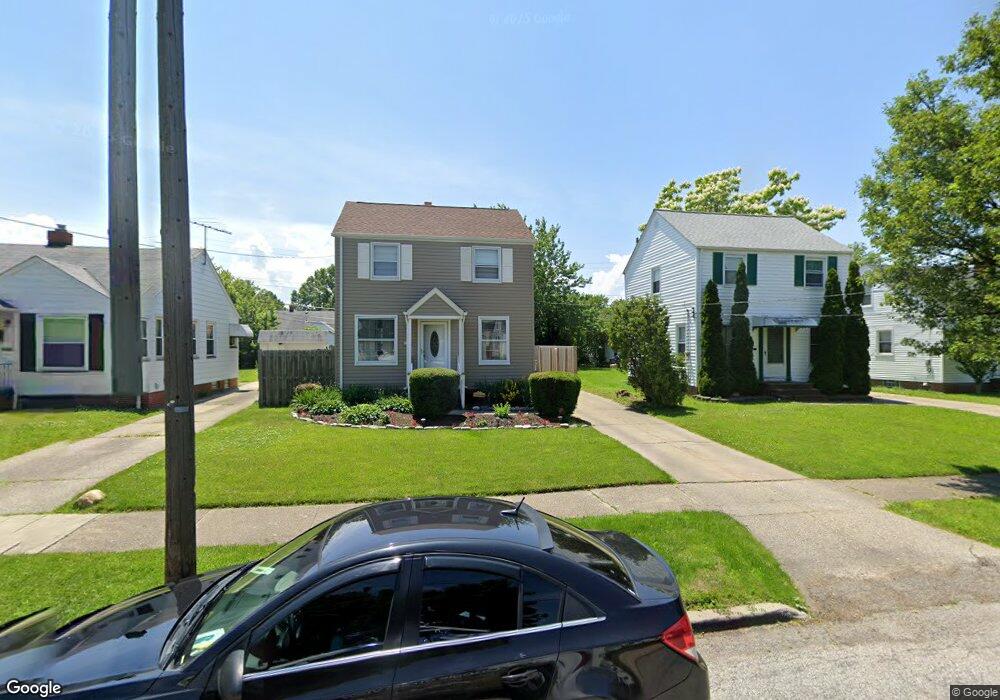
20300 Wilmore Ave Euclid, OH 44123
Estimated Value: $102,882 - $145,000
2
Beds
1
Bath
968
Sq Ft
$123/Sq Ft
Est. Value
About This Home
This home is located at 20300 Wilmore Ave, Euclid, OH 44123 and is currently estimated at $118,971, approximately $122 per square foot. 20300 Wilmore Ave is a home located in Cuyahoga County with nearby schools including Arbor Elementary School, Euclid Middle School, and Euclid High School.
Ownership History
Date
Name
Owned For
Owner Type
Purchase Details
Closed on
Nov 20, 2000
Sold by
Household Finance Corp
Bought by
Bealer Peantay L
Current Estimated Value
Home Financials for this Owner
Home Financials are based on the most recent Mortgage that was taken out on this home.
Original Mortgage
$66,948
Outstanding Balance
$24,581
Interest Rate
7.83%
Mortgage Type
FHA
Estimated Equity
$94,390
Purchase Details
Closed on
Aug 9, 2000
Sold by
Jenkins Joel A
Bought by
Household Finance Corp
Purchase Details
Closed on
May 31, 1995
Sold by
Est Jeanne M Young
Bought by
Jenkins Joel A and Jenkins Dione C
Home Financials for this Owner
Home Financials are based on the most recent Mortgage that was taken out on this home.
Original Mortgage
$51,300
Interest Rate
8.26%
Mortgage Type
New Conventional
Purchase Details
Closed on
Nov 2, 1978
Sold by
Young Ian and Young Jeanne
Bought by
Young Jeanne M
Purchase Details
Closed on
Jan 1, 1975
Bought by
Young Ian and Young Jeanne
Create a Home Valuation Report for This Property
The Home Valuation Report is an in-depth analysis detailing your home's value as well as a comparison with similar homes in the area
Home Values in the Area
Average Home Value in this Area
Purchase History
| Date | Buyer | Sale Price | Title Company |
|---|---|---|---|
| Bealer Peantay L | $67,500 | -- | |
| Household Finance Corp | $188,800 | -- | |
| Jenkins Joel A | $54,000 | -- | |
| Young Jeanne M | -- | -- | |
| Young Ian | -- | -- |
Source: Public Records
Mortgage History
| Date | Status | Borrower | Loan Amount |
|---|---|---|---|
| Open | Bealer Peantay L | $66,948 | |
| Previous Owner | Jenkins Joel A | $51,300 |
Source: Public Records
Tax History Compared to Growth
Tax History
| Year | Tax Paid | Tax Assessment Tax Assessment Total Assessment is a certain percentage of the fair market value that is determined by local assessors to be the total taxable value of land and additions on the property. | Land | Improvement |
|---|---|---|---|---|
| 2024 | $2,420 | $34,720 | $7,735 | $26,985 |
| 2023 | $1,898 | $21,390 | $6,090 | $15,300 |
| 2022 | $1,856 | $21,390 | $6,090 | $15,300 |
| 2021 | $2,059 | $21,390 | $6,090 | $15,300 |
| 2020 | $1,737 | $16,210 | $4,620 | $11,590 |
| 2019 | $1,558 | $46,300 | $13,200 | $33,100 |
| 2018 | $1,508 | $16,210 | $4,620 | $11,590 |
| 2017 | $1,564 | $13,440 | $3,080 | $10,360 |
| 2016 | $1,567 | $13,440 | $3,080 | $10,360 |
| 2015 | $1,431 | $13,440 | $3,080 | $10,360 |
| 2014 | $1,431 | $13,440 | $3,080 | $10,360 |
Source: Public Records
Map
Nearby Homes
- 20450 Wilmore Ave
- 20101 Tracy Ave
- 20400 Tracy Ave
- 20671 Wilmore Ave
- 20231 Nicholas Ave
- 20760 Westport Ave
- 20801 Morris Ave
- 311 E 197th St
- 20830 Tracy Ave
- 21051 Westport Ave
- 275 E 200th St
- 21170 Wilmore Ave
- 20330 S Lake Shore Blvd
- 21181 Ball Ave
- 19400 Meredith Ave
- 21030 Priday Ave
- 560 E 200th St
- 19450 Naumann Ave
- 21130 Arbor Ave
- 19751 Lake Shore Blvd
- 20270 Wilmore Ave
- 20330 Wilmore Ave
- 20350 Wilmore Ave
- 20250 Wilmore Ave
- 20301 Morris Ave
- 20331 Morris Ave
- 20271 Morris Ave
- 20370 Wilmore Ave
- 20230 Wilmore Ave
- 20251 Morris Ave
- 20351 Morris Ave
- 20301 Wilmore Ave
- 20271 Wilmore Ave
- 20331 Wilmore Ave
- 20231 Morris Ave
- 20200 Wilmore Ave
- 20400 Wilmore Ave
- 20251 Wilmore Ave
- 20351 Wilmore Ave
- 20401 Morris Ave