20301 194th Ave E Orting, WA 98360
Estimated Value: $531,250 - $609,000
3
Beds
2
Baths
2,011
Sq Ft
$288/Sq Ft
Est. Value
About This Home
This home is located at 20301 194th Ave E, Orting, WA 98360 and is currently estimated at $580,063, approximately $288 per square foot. 20301 194th Ave E is a home located in Pierce County with nearby schools including Orting Elementary School, Ptarmigan Ridge Elementary School, and Orting Middle School.
Ownership History
Date
Name
Owned For
Owner Type
Purchase Details
Closed on
May 6, 2008
Sold by
Westside Community Bank
Bought by
Burton Ronald and Burton Judith
Current Estimated Value
Purchase Details
Closed on
Dec 30, 2007
Sold by
Cascadia Homes Llc
Bought by
Westside Community Bank
Purchase Details
Closed on
Nov 22, 2006
Sold by
Hook Richard B and Hook Terrie L
Bought by
Cascadia Homes Llc
Home Financials for this Owner
Home Financials are based on the most recent Mortgage that was taken out on this home.
Original Mortgage
$306,500
Interest Rate
6.37%
Mortgage Type
Construction
Purchase Details
Closed on
Sep 12, 2005
Sold by
Ts Development Llc
Bought by
Hook Richard B and Hook Terrie L
Home Financials for this Owner
Home Financials are based on the most recent Mortgage that was taken out on this home.
Original Mortgage
$700,000
Interest Rate
5.76%
Mortgage Type
Construction
Create a Home Valuation Report for This Property
The Home Valuation Report is an in-depth analysis detailing your home's value as well as a comparison with similar homes in the area
Purchase History
| Date | Buyer | Sale Price | Title Company |
|---|---|---|---|
| Burton Ronald | $320,000 | Ticor | |
| Westside Community Bank | -- | None Available | |
| Cascadia Homes Llc | $142,000 | Ticor Title Of Wa Inc | |
| Hook Richard B | $875,000 | Chicago Title Insurance Co |
Source: Public Records
Mortgage History
| Date | Status | Borrower | Loan Amount |
|---|---|---|---|
| Previous Owner | Cascadia Homes Llc | $306,500 | |
| Previous Owner | Hook Richard B | $700,000 |
Source: Public Records
Tax History
| Year | Tax Paid | Tax Assessment Tax Assessment Total Assessment is a certain percentage of the fair market value that is determined by local assessors to be the total taxable value of land and additions on the property. | Land | Improvement |
|---|---|---|---|---|
| 2025 | $573 | $527,500 | $201,300 | $326,200 |
| 2024 | $573 | $526,100 | $196,900 | $329,200 |
| 2023 | $573 | $489,500 | $190,400 | $299,100 |
| 2022 | $616 | $503,500 | $181,800 | $321,700 |
| 2021 | $575 | $355,000 | $100,100 | $254,900 |
| 2019 | $603 | $330,400 | $91,600 | $238,800 |
| 2018 | $589 | $316,700 | $86,900 | $229,800 |
| 2017 | $634 | $279,600 | $69,800 | $209,800 |
| 2016 | $1,144 | $237,300 | $50,500 | $186,800 |
| 2014 | $1,774 | $232,000 | $41,700 | $190,300 |
| 2013 | $1,774 | $186,400 | $37,400 | $149,000 |
Source: Public Records
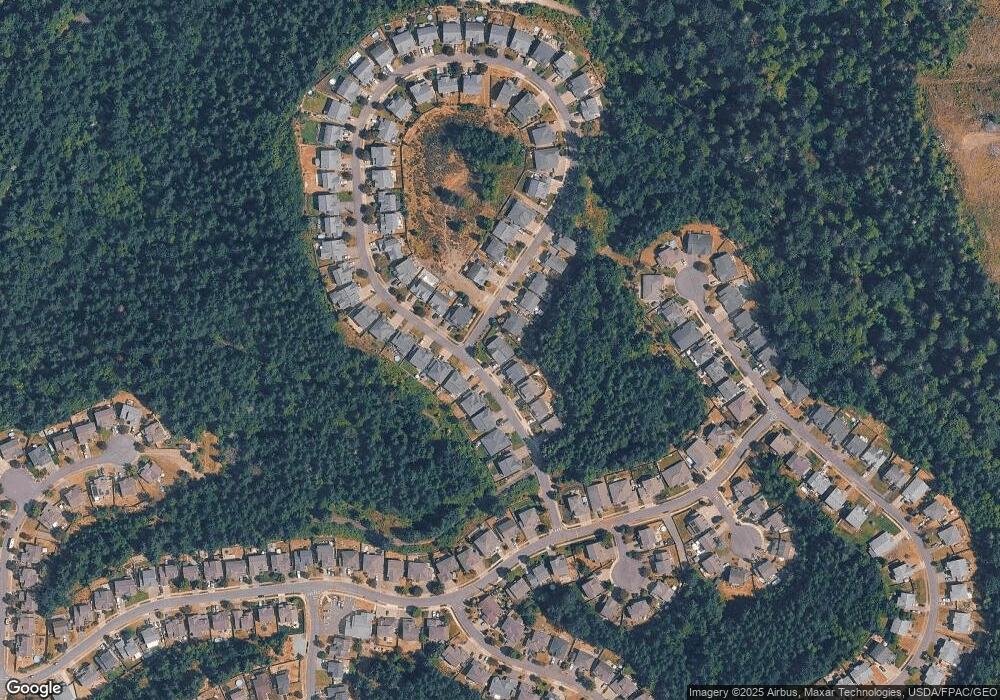
Map
Nearby Homes
- 19123 205th St E
- 19205 206th Stct E
- 19620 199th St E
- 20702 190th Ave E
- 0 196th Ave E
- 19713 196th Ave E
- 19510 190th Ave E
- 19210 Pioneer Way E
- 112 Madrona Ln SW
- 18920 217th Ave E
- 836 Harman Way S Unit 73
- 836 Harman Way S Unit 4
- 103 Balmer St SW
- 204 Balmer St SW
- 317 Icey St SW
- 17012 226th Street Ct E
- 18313 Patterson Rd E
- 411 Hardefeldt St SE
- 213 Bridge St SW
- 211 Bridge St SW
- 20309 194th Ave E
- 20213 195th Ave E
- 20225 194th Ave E
- 20216 195th Ave E
- 20209 195th Ave E
- 20302 194th Ave E
- 20310 194th Ave E
- 20228 194th Ave E
- 20219 194th Ave E
- 20314 194th Ave E
- 20205 195th Ave E
- 20208 195th Ave E
- 20224 194th Ave E
- 20404 194th Ave E
- 20211 194th Ave E
- 20204 195th Ave E
- 20407 194th Ave E
- 20218 194th Ave E
- 20113 195th Ave E
Your Personal Tour Guide
Ask me questions while you tour the home.