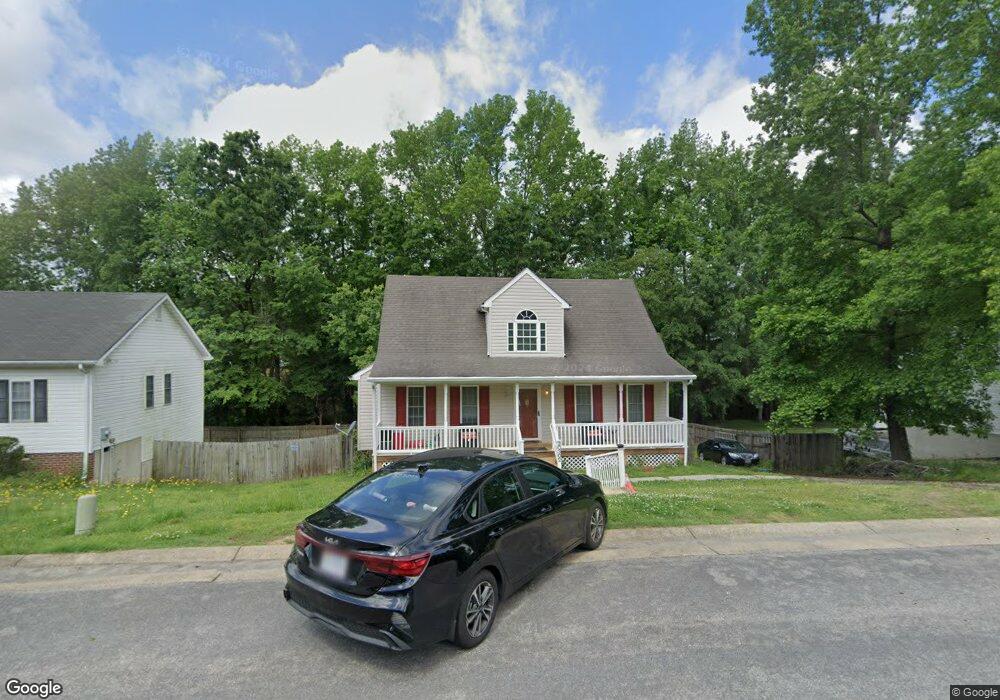
20302 Hickory Branch Rd South Chesterfield, VA 23803
South Chesterfield County NeighborhoodEstimated Value: $329,000 - $374,066
6
Beds
3
Baths
2,520
Sq Ft
$138/Sq Ft
Est. Value
About This Home
This home is located at 20302 Hickory Branch Rd, South Chesterfield, VA 23803 and is currently estimated at $348,017, approximately $138 per square foot. 20302 Hickory Branch Rd is a home located in Chesterfield County with nearby schools including Ettrick Elementary School, Matoaca Middle School, and Matoaca High School.
Ownership History
Date
Name
Owned For
Owner Type
Purchase Details
Closed on
May 24, 2017
Sold by
New Generations Federal Credit Union
Bought by
Williams Patricia E
Current Estimated Value
Home Financials for this Owner
Home Financials are based on the most recent Mortgage that was taken out on this home.
Original Mortgage
$165,938
Outstanding Balance
$138,562
Interest Rate
4.25%
Mortgage Type
FHA
Estimated Equity
$209,455
Purchase Details
Closed on
Oct 10, 2016
Sold by
Ayers Lafayette and Whitlock Plc A Virgini
Bought by
New Generations Federal Credit Union
Purchase Details
Closed on
Dec 3, 2004
Sold by
Roadrunner Enterprises In
Bought by
Lipscomb Christopher
Home Financials for this Owner
Home Financials are based on the most recent Mortgage that was taken out on this home.
Original Mortgage
$155,800
Interest Rate
5.74%
Mortgage Type
New Conventional
Create a Home Valuation Report for This Property
The Home Valuation Report is an in-depth analysis detailing your home's value as well as a comparison with similar homes in the area
Home Values in the Area
Average Home Value in this Area
Purchase History
| Date | Buyer | Sale Price | Title Company |
|---|---|---|---|
| Williams Patricia E | $169,000 | Attorney | |
| New Generations Federal Credit Union | $150,000 | None Available | |
| Lipscomb Christopher | $164,000 | -- |
Source: Public Records
Mortgage History
| Date | Status | Borrower | Loan Amount |
|---|---|---|---|
| Open | Williams Patricia E | $165,938 | |
| Previous Owner | Lipscomb Christopher | $155,800 |
Source: Public Records
Tax History Compared to Growth
Tax History
| Year | Tax Paid | Tax Assessment Tax Assessment Total Assessment is a certain percentage of the fair market value that is determined by local assessors to be the total taxable value of land and additions on the property. | Land | Improvement |
|---|---|---|---|---|
| 2025 | $2,991 | $333,300 | $42,800 | $290,500 |
| 2024 | $2,991 | $320,000 | $42,800 | $277,200 |
| 2023 | $2,905 | $295,200 | $39,900 | $255,300 |
| 2022 | $2,194 | $238,500 | $37,100 | $201,400 |
| 2021 | $1,994 | $207,300 | $35,200 | $172,100 |
| 2020 | $1,912 | $201,300 | $35,200 | $166,100 |
| 2019 | $1,716 | $180,600 | $35,200 | $145,400 |
| 2018 | $1,660 | $174,700 | $34,200 | $140,500 |
| 2017 | $1,577 | $164,300 | $33,300 | $131,000 |
| 2016 | $1,711 | $161,400 | $33,300 | $128,100 |
| 2015 | $1,711 | $178,200 | $35,000 | $143,200 |
| 2014 | $1,785 | $185,900 | $36,000 | $149,900 |
Source: Public Records
Map
Nearby Homes
- 20605 Willowdale Dr
- 4221 Butler Ln
- 20528 Southlawn Ave
- 20531 Southlawn Ave
- 20307 Woodpecker Rd
- 19860 Woodpecker Rd
- 3700 Peachtree Rd
- 20201 Laurel Rd
- 19713 Walker Ave
- 3900 Temple Ct
- 19700 Thelma Ave
- 21217 Trojan Dr
- 3403 Julep Dr
- 19409 Temple Ave
- 19515 Julep Cir
- 3306 E River Rd
- 4305 Lakeview Rd
- 3020 Plumtree St
- 19301 Varanda Ln
- 3710 Totty St
- 20300 Hickory Branch Dr
- 20302 Hickory Branch Dr
- 20300 Hickory Branch Dr
- 20304 Hickory Branch Dr
- 20306 Hickory Branch Rd
- 20212 Hickory Branch Dr
- 20212 Hickory Branch Dr
- 20306 Hickory Branch Dr
- 20303 Hickory Branch Dr
- 20303 Hickory Branch Dr
- 20305 Stonewood Manor Dr
- 4437 Oldtown Creek Rd
- 20308 Hickory Branch Rd
- 20303 Stonewood Manor Dr
- 20210 Hickory Branch Dr
- 20307 Stonewood Manor Dr
- 20305 Hickory Branch Dr
- 20308 Hickory Branch Dr
- 20301 Stonewood Manor Dr
- 20309 Stonewood Manor Dr