20303 Spring Creek Trail Buffalo Creek, CO 80425
Estimated Value: $891,000 - $1,819,000
3
Beds
7
Baths
3,864
Sq Ft
$331/Sq Ft
Est. Value
About This Home
This home is located at 20303 Spring Creek Trail, Buffalo Creek, CO 80425 and is currently estimated at $1,280,568, approximately $331 per square foot. 20303 Spring Creek Trail is a home with nearby schools including Elk Creek Elementary School, West Jefferson Middle School, and Conifer Senior High School.
Ownership History
Date
Name
Owned For
Owner Type
Purchase Details
Closed on
Nov 17, 2015
Sold by
Wickard Jeanne M and Estate Of Paul J Visca
Bought by
Keck David L and Keck Theresa A
Current Estimated Value
Home Financials for this Owner
Home Financials are based on the most recent Mortgage that was taken out on this home.
Original Mortgage
$200,000
Outstanding Balance
$157,416
Interest Rate
3.81%
Mortgage Type
New Conventional
Estimated Equity
$1,123,152
Purchase Details
Closed on
May 2, 2002
Sold by
Visca Paul J and Faust Dee
Bought by
Visca Paul J
Home Financials for this Owner
Home Financials are based on the most recent Mortgage that was taken out on this home.
Original Mortgage
$247,500
Interest Rate
7.19%
Purchase Details
Closed on
Apr 4, 1995
Sold by
Spencer Dan A
Bought by
Visca Paul J and Faust Dee
Home Financials for this Owner
Home Financials are based on the most recent Mortgage that was taken out on this home.
Original Mortgage
$324,000
Interest Rate
8.66%
Create a Home Valuation Report for This Property
The Home Valuation Report is an in-depth analysis detailing your home's value as well as a comparison with similar homes in the area
Home Values in the Area
Average Home Value in this Area
Purchase History
| Date | Buyer | Sale Price | Title Company |
|---|---|---|---|
| Keck David L | $250,000 | None Available | |
| Visca Paul J | -- | -- | |
| Visca Paul J | $360,000 | Land Title |
Source: Public Records
Mortgage History
| Date | Status | Borrower | Loan Amount |
|---|---|---|---|
| Open | Keck David L | $200,000 | |
| Previous Owner | Visca Paul J | $247,500 | |
| Previous Owner | Visca Paul J | $324,000 |
Source: Public Records
Tax History Compared to Growth
Tax History
| Year | Tax Paid | Tax Assessment Tax Assessment Total Assessment is a certain percentage of the fair market value that is determined by local assessors to be the total taxable value of land and additions on the property. | Land | Improvement |
|---|---|---|---|---|
| 2024 | $6,422 | $73,785 | $17,806 | $55,979 |
| 2023 | $6,422 | $73,785 | $17,806 | $55,979 |
| 2022 | $4,619 | $52,262 | $12,784 | $39,478 |
| 2021 | $4,662 | $53,766 | $13,152 | $40,614 |
| 2020 | $3,975 | $45,956 | $9,880 | $36,076 |
| 2019 | $3,914 | $45,956 | $9,880 | $36,076 |
| 2018 | $3,913 | $44,426 | $7,488 | $36,938 |
| 2017 | $3,560 | $44,426 | $7,488 | $36,938 |
| 2016 | $3,974 | $46,363 | $8,855 | $37,508 |
| 2015 | $3,692 | $46,363 | $8,855 | $37,508 |
| 2014 | $3,692 | $40,418 | $11,117 | $29,301 |
Source: Public Records
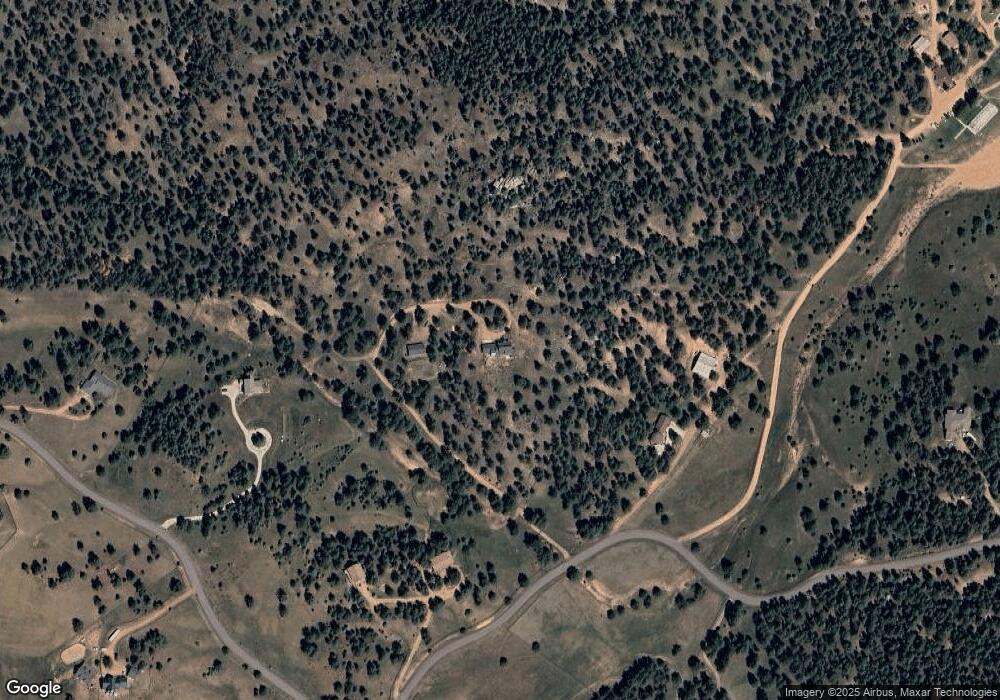
Map
Nearby Homes
- 20065 Spring Creek Rd
- 21206 Spring Creek Rd
- 24676 River Meadow Dr
- 2677 S Platte River Rd
- 0 W Meadow Rd Unit REC3782280
- 0 Brynmawr Rd
- 16670 County Road 126
- 245 Pine Creek Rd
- 12511 W Tina Ln
- 22511 Resort Creek Rd
- 28488 Park Ave
- 17016 Icehouse Ct Unit 6
- 898 S Co Highway 67
- 898 S Co Highway 67 Unit A-1
- 375 N County Highway 67
- 27403 Schuyler Gulch Rd
- 16596 Ouray Rd W
- 25754 County Road 126
- 16626 Ouray Rd W
- 15751 S Elk Creek Rd
- 20273 Spring Creek Trail
- 20393 Spring Creek Trail
- 20333 Spring Creek Trail
- 00 Spring Creek Trail
- 20065 Spring Creek Rd
- 20202 Spring Creek Trail
- 20173 Spring Creek Trail
- 20173 Spring Creek Trail
- 20352 Spring Creek Trail
- 20352 Spring Creek Trail
- 20433 Spring Creek Trail
- 20433 Spring Creek Trail
- 20372 Spring Creek Trail
- 19604 Conifer Mountain Dr
- 19604 Cumbres Way
- 20122 Spring Creek Trail
- 20005 Spring Creek Rd
- 20076 Spring Creek Rd
- 20153 Spring Creek Trail
- 19644 Cumbres Way