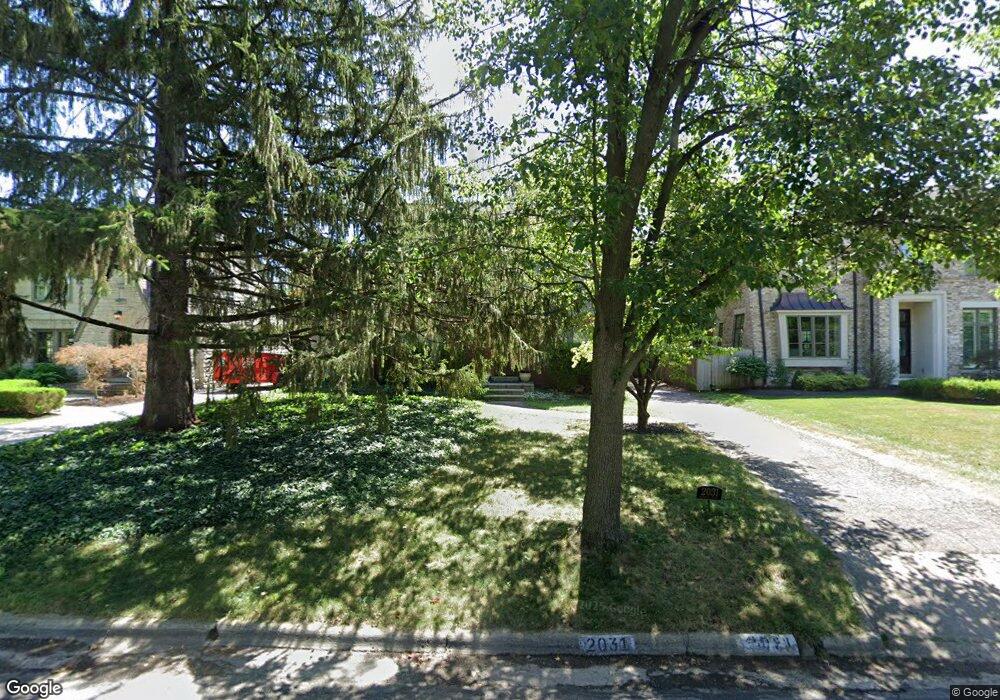
2031 Beverly Rd Columbus, OH 43221
Estimated Value: $976,000 - $1,026,625
4
Beds
4
Baths
2,604
Sq Ft
$387/Sq Ft
Est. Value
About This Home
This home is located at 2031 Beverly Rd, Columbus, OH 43221 and is currently estimated at $1,008,406, approximately $387 per square foot. 2031 Beverly Rd is a home located in Franklin County with nearby schools including Barrington Road Elementary School, Jones Middle School, and Upper Arlington High School.
Ownership History
Date
Name
Owned For
Owner Type
Purchase Details
Closed on
Aug 22, 2005
Sold by
Emery Christopher J and Emery Irene D
Bought by
Binkley Philip F and Kiacz Mary Lynn
Current Estimated Value
Home Financials for this Owner
Home Financials are based on the most recent Mortgage that was taken out on this home.
Original Mortgage
$359,650
Outstanding Balance
$186,076
Interest Rate
5.82%
Mortgage Type
Fannie Mae Freddie Mac
Estimated Equity
$822,330
Purchase Details
Closed on
Dec 15, 1992
Bought by
Emery Christopher J
Purchase Details
Closed on
Jun 4, 1992
Purchase Details
Closed on
Jul 1, 1979
Create a Home Valuation Report for This Property
The Home Valuation Report is an in-depth analysis detailing your home's value as well as a comparison with similar homes in the area
Home Values in the Area
Average Home Value in this Area
Purchase History
| Date | Buyer | Sale Price | Title Company |
|---|---|---|---|
| Binkley Philip F | $550,000 | -- | |
| Emery Christopher J | $208,000 | -- | |
| -- | $195,000 | -- | |
| -- | $91,000 | -- |
Source: Public Records
Mortgage History
| Date | Status | Borrower | Loan Amount |
|---|---|---|---|
| Open | Binkley Philip F | $359,650 |
Source: Public Records
Tax History
| Year | Tax Paid | Tax Assessment Tax Assessment Total Assessment is a certain percentage of the fair market value that is determined by local assessors to be the total taxable value of land and additions on the property. | Land | Improvement |
|---|---|---|---|---|
| 2025 | $24,252 | $280,430 | $121,280 | $159,150 |
| 2024 | $24,252 | $280,430 | $121,280 | $159,150 |
| 2023 | $16,034 | $280,420 | $121,275 | $159,145 |
| 2022 | $14,963 | $214,130 | $66,150 | $147,980 |
| 2021 | $13,245 | $214,130 | $66,150 | $147,980 |
| 2020 | $13,128 | $214,130 | $66,150 | $147,980 |
| 2019 | $13,087 | $188,720 | $66,150 | $122,570 |
| 2018 | $12,765 | $188,720 | $66,150 | $122,570 |
| 2017 | $12,923 | $188,720 | $66,150 | $122,570 |
| 2016 | $12,760 | $191,490 | $51,350 | $140,140 |
| 2015 | $12,518 | $187,990 | $51,350 | $136,640 |
| 2014 | $12,433 | $187,990 | $51,350 | $136,640 |
| 2013 | $5,987 | $170,905 | $46,690 | $124,215 |
Source: Public Records
Map
Nearby Homes
- 2208 Arlington Ave
- 2151 Fairfax Rd
- 1869 Tewksbury Rd
- 2165 S Parkway Dr
- 2583 Wexford Rd
- 1960 Hillside Dr
- 1565 Berkshire Rd
- 1940 Scioto Pointe Dr
- 2585 Westmont Blvd
- 1508 Berkshire Rd
- 2245 Riverside Dr Unit 309
- 2329 Keep Place Unit 2329
- 1631 Roxbury Rd Unit F3
- 1810 Ashland Ave
- 2015 W 5th Ave Unit 211
- 2015 W 5th Ave Unit 102
- 2015 W 5th Ave Unit 108
- 2022 Lake Shore Dr
- 1585 Arlington Ave Unit 1585A
- 1579 Arlington Ave Unit 1579B
- 2041 Beverly Rd
- 2025 Beverly Rd
- 2019 Beverly Rd
- 2250 Arlington Ave
- 2018 Tewksbury Rd
- 2012 Tewksbury Rd
- 2024 Tewksbury Rd
- 2006 Tewksbury Rd
- 2011 Beverly Rd
- 2036 Beverly Rd
- 2044 Beverly Rd
- 2230 Arlington Ave
- 2026 Beverly Rd
- 0 Beverly Rd
- 1998 Tewksbury Rd
- 2020 Beverly Rd
- 2270 Arlington Ave
- 2003 Beverly Rd
- 2014 Beverly Rd
- 1992 Tewksbury Rd
Your Personal Tour Guide
Ask me questions while you tour the home.