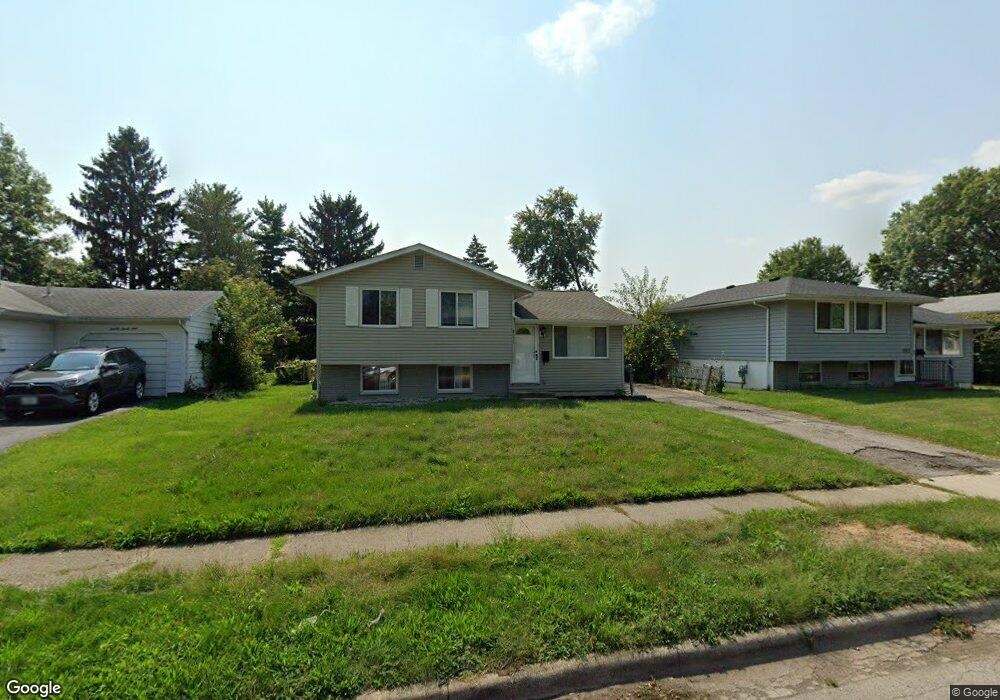
2031 Brookfield Rd Columbus, OH 43229
Forest Park East NeighborhoodEstimated Value: $243,171 - $268,000
3
Beds
1
Bath
1,444
Sq Ft
$177/Sq Ft
Est. Value
About This Home
This home is located at 2031 Brookfield Rd, Columbus, OH 43229 and is currently estimated at $255,543, approximately $176 per square foot. 2031 Brookfield Rd is a home located in Franklin County with nearby schools including Forest Park Elementary School, Woodward Park Middle School, and Northland High School.
Ownership History
Date
Name
Owned For
Owner Type
Purchase Details
Closed on
Jun 24, 2005
Sold by
Wolfinger Paula L and Wolfinger Brent J
Bought by
Tawiah Emmanuel K and Tawiah Christina A
Current Estimated Value
Home Financials for this Owner
Home Financials are based on the most recent Mortgage that was taken out on this home.
Original Mortgage
$127,893
Outstanding Balance
$66,725
Interest Rate
5.75%
Mortgage Type
FHA
Estimated Equity
$188,818
Purchase Details
Closed on
May 6, 2005
Sold by
Estate Of Nancy J Davis
Bought by
Wolfinger Paula L
Home Financials for this Owner
Home Financials are based on the most recent Mortgage that was taken out on this home.
Original Mortgage
$127,893
Outstanding Balance
$66,725
Interest Rate
5.75%
Mortgage Type
FHA
Estimated Equity
$188,818
Purchase Details
Closed on
Sep 27, 1991
Bought by
Davis Nancy J
Create a Home Valuation Report for This Property
The Home Valuation Report is an in-depth analysis detailing your home's value as well as a comparison with similar homes in the area
Home Values in the Area
Average Home Value in this Area
Purchase History
| Date | Buyer | Sale Price | Title Company |
|---|---|---|---|
| Tawiah Emmanuel K | $129,900 | Talon Group | |
| Wolfinger Paula L | -- | -- | |
| Davis Nancy J | -- | -- |
Source: Public Records
Mortgage History
| Date | Status | Borrower | Loan Amount |
|---|---|---|---|
| Open | Tawiah Emmanuel K | $127,893 |
Source: Public Records
Tax History Compared to Growth
Tax History
| Year | Tax Paid | Tax Assessment Tax Assessment Total Assessment is a certain percentage of the fair market value that is determined by local assessors to be the total taxable value of land and additions on the property. | Land | Improvement |
|---|---|---|---|---|
| 2024 | $2,919 | $65,040 | $16,630 | $48,410 |
| 2023 | $2,941 | $65,030 | $16,625 | $48,405 |
| 2022 | $2,400 | $46,280 | $10,610 | $35,670 |
| 2021 | $2,940 | $46,280 | $10,610 | $35,670 |
| 2020 | $2,408 | $46,280 | $10,610 | $35,670 |
| 2019 | $2,100 | $34,620 | $7,840 | $26,780 |
| 2018 | $2,035 | $34,620 | $7,840 | $26,780 |
| 2017 | $2,099 | $34,620 | $7,840 | $26,780 |
| 2016 | $2,175 | $32,840 | $7,390 | $25,450 |
| 2015 | $1,975 | $32,840 | $7,390 | $25,450 |
| 2014 | $1,980 | $32,840 | $7,390 | $25,450 |
| 2013 | $1,027 | $34,545 | $7,770 | $26,775 |
Source: Public Records
Map
Nearby Homes
- 2084 Brookfield Rd
- 1914 Walden Dr
- 5726 Beechcroft Rd Unit J
- 1881 Brimfield Rd
- 5732 Beechcroft Rd Unit B
- 5485 Tamarack Blvd
- 5522 Parkshire Dr Unit 5522
- 5556 Parkshire Dr Unit 5556
- 5578 Parkshire Dr Unit 5578
- 2294 Teakwood Dr
- 1722 Blue Ash Place
- 5204 Honeytree Loop W
- 1752 Pine Tree St S Unit H
- 5727 Tamarack Blvd Unit A
- 1743 Pine Tree St N Unit A
- 1687 Brookfield Square S
- 2250 Webster Canyon Ct
- 2058 Northcliff Dr
- 5056 Northtowne Blvd Unit 5054
- 6019 Beechcroft Rd
- 2023 Brookfield Rd
- 2039 Brookfield Rd
- 2017 Brookfield Rd
- 2028 Sumac Dr
- 2038 Sumac Dr
- 2020 Sumac Dr
- 2011 Brookfield Rd
- 2053 Brookfield Rd
- 2046 Sumac Dr
- 2034 Brookfield Rd
- 2040 Brookfield Rd
- 2012 Sumac Dr
- 2018 Brookfield Rd
- 2048 Brookfield Rd
- 2054 Sumac Dr
- 2003 Brookfield Rd
- 2061 Brookfield Rd
- 2012 Brookfield Rd
- 2004 Sumac Dr
- 2056 Brookfield Rd