Estimated Value: $403,120 - $455,000
4
Beds
4
Baths
2,196
Sq Ft
$194/Sq Ft
Est. Value
About This Home
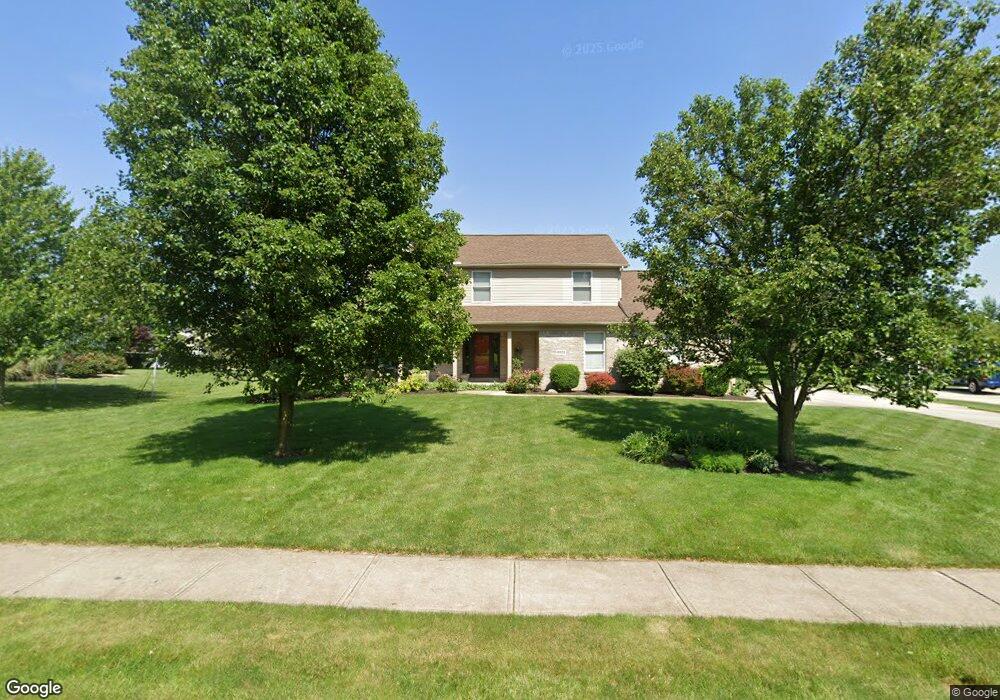
This home is located at 2031 Hancock Ct, Xenia, OH 45385 and is currently estimated at $426,530, approximately $194 per square foot. 2031 Hancock Ct is a home located in Greene County with nearby schools including Xenia High School.
Ownership History
Date
Name
Owned For
Owner Type
Purchase Details
Closed on
Jan 5, 2016
Sold by
Mcclelland Michael W and Mcclelland Jane F
Bought by
Dill Travis K and Dill Erin M
Current Estimated Value
Purchase Details
Closed on
Sep 25, 2009
Sold by
Muterspaw Shane T and Muterspaw Kelly Jo
Bought by
Mcclelland Michael W and Mcclelland Jane F
Home Financials for this Owner
Home Financials are based on the most recent Mortgage that was taken out on this home.
Original Mortgage
$172,000
Interest Rate
5.19%
Mortgage Type
New Conventional
Purchase Details
Closed on
Mar 30, 2001
Sold by
Countrytyme Lebanon Ltd
Bought by
Muterspaw Shane T and Muterspaw Kelly Jo
Home Financials for this Owner
Home Financials are based on the most recent Mortgage that was taken out on this home.
Original Mortgage
$154,400
Interest Rate
7.13%
Mortgage Type
Construction
Create a Home Valuation Report for This Property
The Home Valuation Report is an in-depth analysis detailing your home's value as well as a comparison with similar homes in the area
Home Values in the Area
Average Home Value in this Area
Purchase History
| Date | Buyer | Sale Price | Title Company |
|---|---|---|---|
| Dill Travis K | $230,000 | None Available | |
| Mcclelland Michael W | $215,000 | Attorney | |
| Muterspaw Shane T | $32,000 | -- |
Source: Public Records
Mortgage History
| Date | Status | Borrower | Loan Amount |
|---|---|---|---|
| Closed | Mcclelland Michael W | $172,000 | |
| Previous Owner | Muterspaw Shane T | $154,400 |
Source: Public Records
Tax History Compared to Growth
Tax History
| Year | Tax Paid | Tax Assessment Tax Assessment Total Assessment is a certain percentage of the fair market value that is determined by local assessors to be the total taxable value of land and additions on the property. | Land | Improvement |
|---|---|---|---|---|
| 2024 | $4,688 | $109,570 | $23,100 | $86,470 |
| 2023 | $4,688 | $109,570 | $23,100 | $86,470 |
| 2022 | $3,969 | $79,120 | $14,440 | $64,680 |
| 2021 | $4,023 | $79,120 | $14,440 | $64,680 |
| 2020 | $3,854 | $79,120 | $14,440 | $64,680 |
| 2019 | $3,806 | $73,550 | $13,120 | $60,430 |
| 2018 | $3,821 | $73,550 | $13,120 | $60,430 |
| 2017 | $3,619 | $73,550 | $13,120 | $60,430 |
| 2016 | $3,619 | $70,240 | $13,120 | $57,120 |
| 2015 | $1,815 | $70,240 | $13,120 | $57,120 |
| 2014 | $3,472 | $70,240 | $13,120 | $57,120 |
Source: Public Records
Map
Nearby Homes
- 1030 Independence Dr
- 1056 Eastland Dr
- 955 Oak Dale Dr
- 965 Oak Dale Dr
- 1764 Highlander Dr
- 1359 Eagles Way
- 129 Outerview Dr
- 15 Sexton Dr
- 745 Doral Dr
- 2537 Ridge Rd
- 167 Beverly Place
- 656 Eden Roc Dr
- 610 Saxony Dr
- 289 Hollywood Blvd
- 513 Redbud Ln
- 1287 Brush Row Rd
- 1872 Harris Ln
- 0 US 42 Unit 941174
- 0 US 42 Unit 1042511
- 878 N Detroit St
- 1071 Independence Dr
- 1061 Independence Dr
- 2025 Hancock Ct
- 2034 Liberty Ct
- 2032 Hancock Ct
- 2028 Liberty Ct
- 2038 Hancock Ct
- 1051 Independence Dr
- 2026 Hancock Ct
- 1070 Independence Dr
- 1060 Independence Dr
- 1080 Independence Dr
- 1050 Independence Dr
- 2039 Liberty Ct
- 1040 Independence Dr
- 2033 Liberty Ct
- 2027 Liberty Ct
- 554 Kinsey Rd
- 480 Kinsey Rd
- 1011 Independence Dr