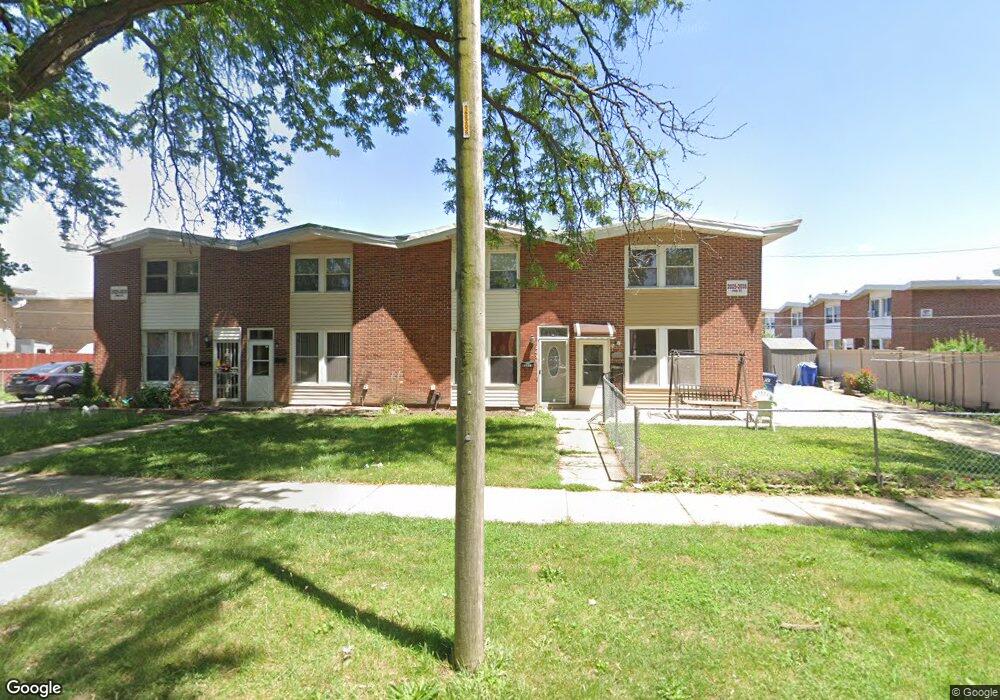
2031 Pine St Unit D Des Plaines, IL 60018
Estimated Value: $250,000 - $299,000
3
Beds
3
Baths
1,152
Sq Ft
$235/Sq Ft
Est. Value
About This Home
This home is located at 2031 Pine St Unit D, Des Plaines, IL 60018 and is currently estimated at $270,223, approximately $234 per square foot. 2031 Pine St Unit D is a home located in Cook County with nearby schools including Plainfield Elementary School, Algonquin Middle School, and Maine West High School.
Ownership History
Date
Name
Owned For
Owner Type
Purchase Details
Closed on
Jun 10, 2015
Sold by
Federal Home Loan Mortgage Corporation
Bought by
Patel Ghanesh and Patel Neha
Current Estimated Value
Purchase Details
Closed on
Apr 11, 2014
Sold by
Ali Saif
Bought by
Federal Home Loan Mortgage Corporation
Purchase Details
Closed on
Jul 27, 2004
Sold by
Karim Samira A
Bought by
Ali Saif
Home Financials for this Owner
Home Financials are based on the most recent Mortgage that was taken out on this home.
Original Mortgage
$168,000
Interest Rate
8.9%
Mortgage Type
Unknown
Purchase Details
Closed on
Sep 14, 1996
Sold by
Hud
Bought by
Karim Samira A
Home Financials for this Owner
Home Financials are based on the most recent Mortgage that was taken out on this home.
Original Mortgage
$56,800
Interest Rate
8.26%
Mortgage Type
Balloon
Create a Home Valuation Report for This Property
The Home Valuation Report is an in-depth analysis detailing your home's value as well as a comparison with similar homes in the area
Home Values in the Area
Average Home Value in this Area
Purchase History
| Date | Buyer | Sale Price | Title Company |
|---|---|---|---|
| Patel Ghanesh | $86,500 | None Available | |
| Federal Home Loan Mortgage Corporation | -- | None Available | |
| Ali Saif | $178,000 | Ticor | |
| Karim Samira A | -- | -- |
Source: Public Records
Mortgage History
| Date | Status | Borrower | Loan Amount |
|---|---|---|---|
| Previous Owner | Ali Saif | $168,000 | |
| Previous Owner | Karim Samira A | $56,800 |
Source: Public Records
Tax History Compared to Growth
Tax History
| Year | Tax Paid | Tax Assessment Tax Assessment Total Assessment is a certain percentage of the fair market value that is determined by local assessors to be the total taxable value of land and additions on the property. | Land | Improvement |
|---|---|---|---|---|
| 2025 | $4,135 | $19,000 | $3,432 | $15,568 |
| 2024 | $4,135 | $19,000 | $3,000 | $16,000 |
| 2023 | $4,009 | $19,000 | $3,000 | $16,000 |
| 2022 | $4,009 | $19,000 | $3,000 | $16,000 |
| 2021 | $2,791 | $12,411 | $1,458 | $10,953 |
| 2020 | $2,813 | $12,411 | $1,458 | $10,953 |
| 2019 | $2,830 | $13,945 | $1,458 | $12,487 |
| 2018 | $2,203 | $10,803 | $1,287 | $9,516 |
| 2017 | $2,182 | $10,803 | $1,287 | $9,516 |
| 2016 | $2,958 | $13,142 | $1,287 | $11,855 |
| 2015 | $3,153 | $13,051 | $1,115 | $11,936 |
| 2014 | $3,102 | $13,051 | $1,115 | $11,936 |
| 2013 | $3,007 | $13,051 | $1,115 | $11,936 |
Source: Public Records
Map
Nearby Homes
- 1864 Illinois St
- 1445 Everett Ave
- 1783 Lee St
- 1696 S Elm St
- 1721 Prospect Ave
- 1689 S Elm St
- 1673 Spruce Ave
- 1629 E Touhy Ave
- 1641 E Touhy Ave
- 1625 Estes Ave
- 1845 Everett Ave
- 1686 Greenleaf Ave
- 2500 Maple St
- 1050 E Oakton St
- 1939 E Touhy Ave
- 1754 E Lincoln Ave
- 1640 S River Rd
- 2646 Maple St
- 614 Birchwood Ave
- 807 Fairmont Ct