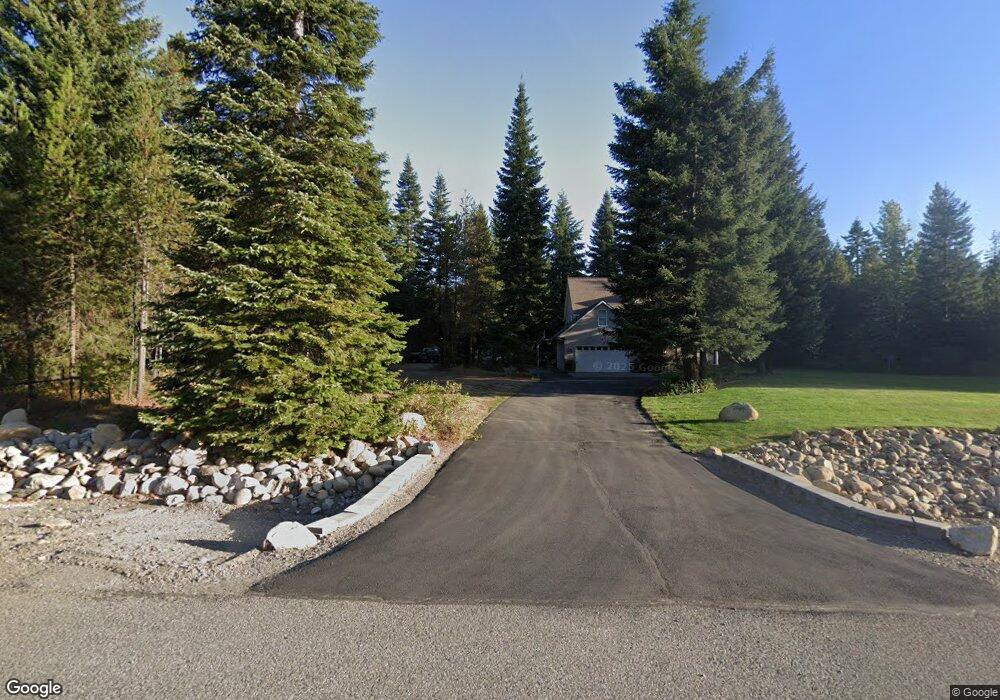
2031 W Jesse Ct Rathdrum, ID 83858
Estimated Value: $1,152,000 - $1,364,870
5
Beds
5
Baths
4,927
Sq Ft
$253/Sq Ft
Est. Value
About This Home
This home is located at 2031 W Jesse Ct, Rathdrum, ID 83858 and is currently estimated at $1,244,623, approximately $252 per square foot. 2031 W Jesse Ct is a home with nearby schools including Twin Lakes Elementary School, Timberlake Junior High School, and Timberlake Senior High School.
Ownership History
Date
Name
Owned For
Owner Type
Purchase Details
Closed on
Jul 12, 2006
Sold by
Wrotenbery Charles S
Bought by
Wrotenbery Charles S and Wrotenbery Tesha J
Current Estimated Value
Home Financials for this Owner
Home Financials are based on the most recent Mortgage that was taken out on this home.
Original Mortgage
$500,000
Interest Rate
6.37%
Mortgage Type
Adjustable Rate Mortgage/ARM
Purchase Details
Closed on
May 5, 2005
Sold by
Wrotenbery Charles Scott and Wrotenbery Tesha Jean
Bought by
Wrotenbery Charles S
Home Financials for this Owner
Home Financials are based on the most recent Mortgage that was taken out on this home.
Original Mortgage
$369,500
Interest Rate
4.12%
Mortgage Type
Adjustable Rate Mortgage/ARM
Create a Home Valuation Report for This Property
The Home Valuation Report is an in-depth analysis detailing your home's value as well as a comparison with similar homes in the area
Home Values in the Area
Average Home Value in this Area
Purchase History
| Date | Buyer | Sale Price | Title Company |
|---|---|---|---|
| Wrotenbery Charles S | -- | -- | |
| Wrotenbery Charles S | -- | -- |
Source: Public Records
Mortgage History
| Date | Status | Borrower | Loan Amount |
|---|---|---|---|
| Closed | Wrotenbery Charles S | $500,000 | |
| Closed | Wrotenbery Charles S | $369,500 |
Source: Public Records
Tax History Compared to Growth
Tax History
| Year | Tax Paid | Tax Assessment Tax Assessment Total Assessment is a certain percentage of the fair market value that is determined by local assessors to be the total taxable value of land and additions on the property. | Land | Improvement |
|---|---|---|---|---|
| 2025 | $3,486 | $1,093,973 | $431,673 | $662,300 |
| 2024 | $3,486 | $1,097,937 | $427,657 | $670,280 |
| 2023 | $3,486 | $1,116,687 | $446,407 | $670,280 |
| 2022 | $3,973 | $1,114,233 | $443,953 | $670,280 |
| 2021 | $4,261 | $743,543 | $260,263 | $483,280 |
| 2020 | $4,368 | $645,478 | $214,818 | $430,660 |
| 2019 | $4,076 | $540,091 | $171,921 | $368,170 |
| 2018 | $4,214 | $500,436 | $162,656 | $337,780 |
| 2017 | $4,257 | $471,013 | $140,623 | $330,390 |
| 2016 | $3,682 | $436,401 | $122,111 | $314,290 |
| 2015 | $2,802 | $332,930 | $75,000 | $257,930 |
| 2013 | $2,733 | $315,216 | $76,176 | $239,040 |
Source: Public Records
Map
Nearby Homes
- 2115 W Jesse Ct
- 2050 W Jesse Ct
- 2050 W Jesse Ct
- 1985 W Jesse Ct
- 2132 W Jesse Ct
- 1978 W Jesse Ct
- 0 Jesse Ct Unit 4-7105
- 0 Jesse Ct Unit 2-6409
- 0 Jesse Ct Unit 2-8582
- 0 Jesse Ct Unit 2-2931
- 0 Jesse Ct Unit 2-2229
- 0 Jesse Ct Unit 1-4236
- 0 Jesse Ct Unit 1-4235
- 0 Jesse Ct Unit 1-4234
- 0 Jesse Ct Unit 1-4232
- 0 Jesse Ct Unit 1-4220
- 0 Jesse Ct Unit 1-4218
- 0 Jesse Ct Unit 2-4016
- 2229 W Jesse Ct
- 2240 W Jesse Ct