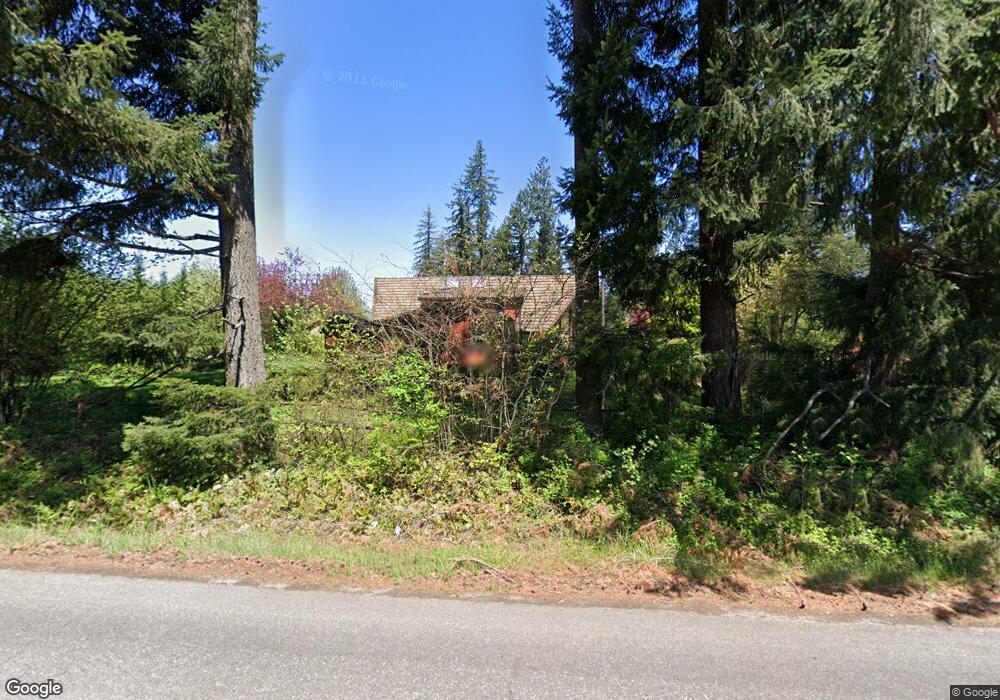
20312 NE 259th St Battle Ground, WA 98604
Estimated Value: $651,000 - $751,000
3
Beds
2
Baths
1,896
Sq Ft
$363/Sq Ft
Est. Value
About This Home
This home is located at 20312 NE 259th St, Battle Ground, WA 98604 and is currently estimated at $689,077, approximately $363 per square foot. 20312 NE 259th St is a home located in Clark County with nearby schools including Tukes Valley Primary School, Tukes Valley Middle School, and Battle Ground High School.
Ownership History
Date
Name
Owned For
Owner Type
Purchase Details
Closed on
Dec 1, 2021
Sold by
Sabin Portia and Moon Matthew E
Bought by
Asbury Brent A and Owen Chelsea R
Current Estimated Value
Home Financials for this Owner
Home Financials are based on the most recent Mortgage that was taken out on this home.
Original Mortgage
$525,800
Outstanding Balance
$483,468
Interest Rate
3.09%
Mortgage Type
FHA
Estimated Equity
$205,609
Purchase Details
Closed on
Dec 19, 2012
Sold by
Greig Donald A and Rivenbark Susan L
Bought by
Smith Michael R and Smith Jill M
Home Financials for this Owner
Home Financials are based on the most recent Mortgage that was taken out on this home.
Original Mortgage
$85,000
Interest Rate
3.87%
Mortgage Type
Adjustable Rate Mortgage/ARM
Purchase Details
Closed on
Oct 26, 2007
Sold by
Greig Donald A and Rivenbark Susan L
Bought by
Sabin Portia and Moon Matthew E
Home Financials for this Owner
Home Financials are based on the most recent Mortgage that was taken out on this home.
Original Mortgage
$389,285
Interest Rate
6.27%
Mortgage Type
Purchase Money Mortgage
Purchase Details
Closed on
Mar 2, 1999
Sold by
Greig Donald A
Bought by
Greig Donald A and Rivenbark Susan L
Create a Home Valuation Report for This Property
The Home Valuation Report is an in-depth analysis detailing your home's value as well as a comparison with similar homes in the area
Home Values in the Area
Average Home Value in this Area
Purchase History
| Date | Buyer | Sale Price | Title Company |
|---|---|---|---|
| Asbury Brent A | $535,500 | First American Title Ins Co | |
| Smith Michael R | $115,000 | Stewart Title | |
| Sabin Portia | $486,609 | Fidelity National Title | |
| Greig Donald A | -- | -- |
Source: Public Records
Mortgage History
| Date | Status | Borrower | Loan Amount |
|---|---|---|---|
| Open | Asbury Brent A | $525,800 | |
| Previous Owner | Smith Michael R | $85,000 | |
| Previous Owner | Sabin Portia | $389,285 |
Source: Public Records
Tax History Compared to Growth
Tax History
| Year | Tax Paid | Tax Assessment Tax Assessment Total Assessment is a certain percentage of the fair market value that is determined by local assessors to be the total taxable value of land and additions on the property. | Land | Improvement |
|---|---|---|---|---|
| 2025 | $4,781 | $595,390 | $269,634 | $325,756 |
| 2024 | $4,092 | $572,966 | $269,634 | $303,332 |
| 2023 | $4,586 | $559,991 | $237,749 | $322,242 |
| 2022 | $4,290 | $574,851 | $229,583 | $345,268 |
| 2021 | $4,241 | $468,101 | $223,040 | $245,061 |
| 2020 | $4,030 | $423,772 | $201,773 | $221,999 |
| 2019 | $3,603 | $392,638 | $188,686 | $203,952 |
| 2018 | $4,265 | $402,856 | $0 | $0 |
| 2017 | $3,463 | $363,674 | $0 | $0 |
| 2016 | $3,295 | $321,644 | $0 | $0 |
| 2015 | $3,233 | $280,594 | $0 | $0 |
| 2014 | -- | $260,382 | $0 | $0 |
| 2013 | -- | $228,270 | $0 | $0 |
Source: Public Records
Map
Nearby Homes
- 19428 NE 259th St
- 0 212th Ave
- 25307 NE 212th Ave
- 19619 NE 272nd St
- 20119 NE 272nd St
- 20607 NE Allworth Rd
- 19301 NE 249th St
- 19815 NE Allworth Rd
- 27120 NE 220th Ave
- 18205 NE 249th St
- 21821 NE Rock Creek Canyon Rd
- 20015 NE 234th St
- 20703 NE Basket Flat Rd
- 23417 NE Canyon Rd
- 19601 NE Lucia Falls Rd
- 19606 NE Lucia Falls Rd
- 18011 NE 289th St
- 18308 NE Cole Witter Rd
- 22814 NE 182nd Ave
- 22314 NE 182nd Ave
- 25914 NE 206th Ave
- 20407 NE 259th St
- 20203 NE 259th St
- 26008 NE 206th Ave
- 26100 NE 204th Ave
- 20112 NE 259th St
- 20315 NE 259th St
- 20511 NE 259th St
- 26204 NE 204th Ave
- 25601 NE 202nd Ave
- 25605 NE 202nd Ave
- 19918 NE 259th St
- 26308 NE 204th Ave
- 20101 NE 259th St
- 19910 NE 259th St
- 26302 NE 206th Ave
- 25519 NE 202nd Ave
- 19806 NE 259th St
- 20700 NE 259th St