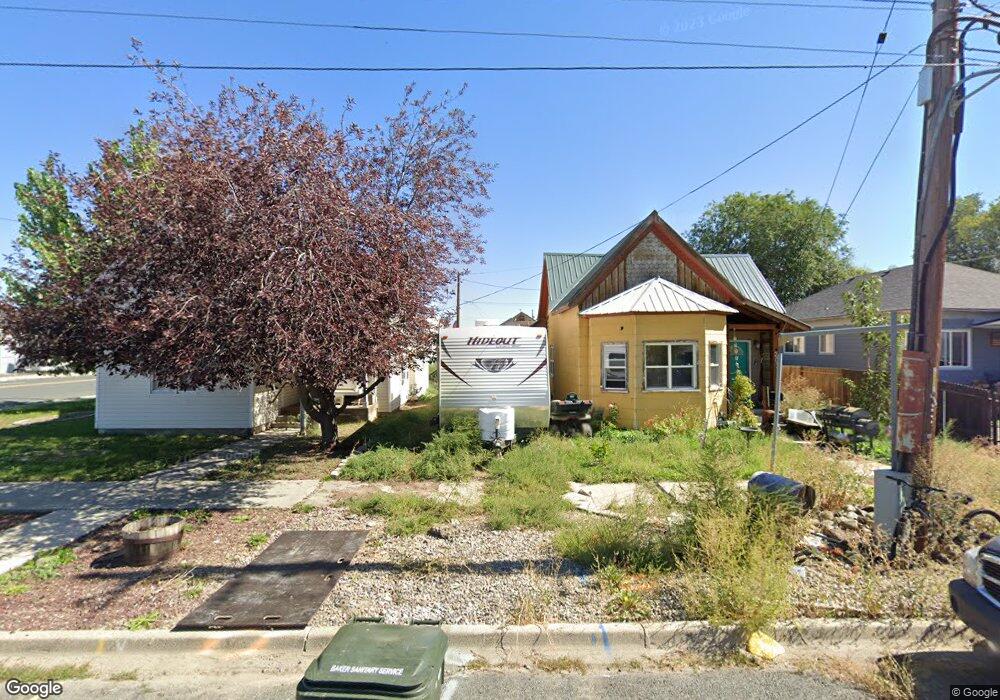
2032 8th St Baker City, OR 97814
Estimated Value: $156,880 - $184,000
2
Beds
1
Bath
996
Sq Ft
$171/Sq Ft
Est. Value
About This Home
This home is located at 2032 8th St, Baker City, OR 97814 and is currently estimated at $170,627, approximately $171 per square foot. 2032 8th St is a home located in Baker County with nearby schools including Brooklyn Primary School, Baker Middle School, and Baker High School.
Ownership History
Date
Name
Owned For
Owner Type
Purchase Details
Closed on
Mar 24, 2020
Sold by
Davis Frances Trust
Bought by
Frix Elijah Daniel
Current Estimated Value
Home Financials for this Owner
Home Financials are based on the most recent Mortgage that was taken out on this home.
Original Mortgage
$80,000
Interest Rate
3.2%
Mortgage Type
Construction
Purchase Details
Closed on
Mar 22, 2016
Sold by
Neff Nathaniel G and Neff Kristin N
Bought by
Clark Kay
Create a Home Valuation Report for This Property
The Home Valuation Report is an in-depth analysis detailing your home's value as well as a comparison with similar homes in the area
Home Values in the Area
Average Home Value in this Area
Purchase History
| Date | Buyer | Sale Price | Title Company |
|---|---|---|---|
| Frix Elijah Daniel | $85,000 | Elkhorn Title Co | |
| Clark Kay | $60,000 | -- |
Source: Public Records
Mortgage History
| Date | Status | Borrower | Loan Amount |
|---|---|---|---|
| Previous Owner | Frix Elijah Daniel | $80,000 |
Source: Public Records
Tax History Compared to Growth
Tax History
| Year | Tax Paid | Tax Assessment Tax Assessment Total Assessment is a certain percentage of the fair market value that is determined by local assessors to be the total taxable value of land and additions on the property. | Land | Improvement |
|---|---|---|---|---|
| 2024 | $906 | $51,145 | $27,855 | $23,290 |
| 2023 | $889 | $49,656 | $27,322 | $22,334 |
| 2022 | $864 | $48,210 | $28,760 | $19,450 |
| 2021 | $838 | $46,806 | $29,844 | $16,962 |
| 2020 | $784 | $45,443 | $34,763 | $10,680 |
| 2019 | $662 | $44,120 | $33,750 | $10,370 |
| 2018 | $591 | $39,420 | $28,060 | $11,360 |
| 2017 | $551 | $36,750 | $25,490 | $11,260 |
| 2016 | $532 | $35,440 | $25,310 | $10,130 |
| 2015 | $542 | $36,120 | $24,950 | $11,170 |
| 2014 | $528 | $35,180 | $24,600 | $10,580 |
| 2013 | -- | $34,130 | $23,930 | $10,200 |
Source: Public Records
Map
Nearby Homes