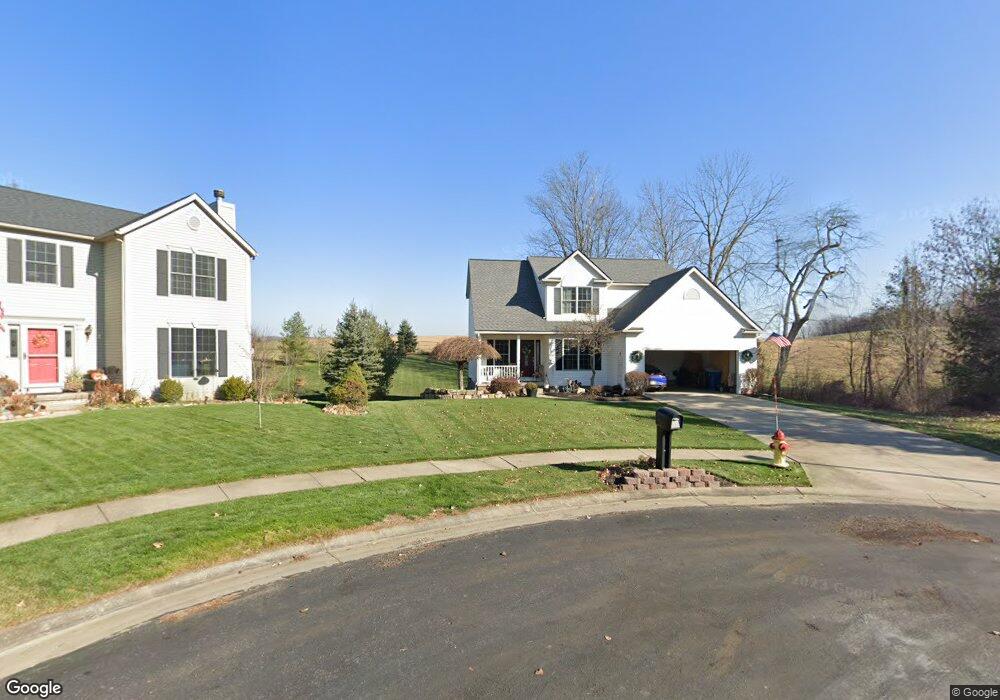
2032 Brittani Cir Canal Fulton, OH 44614
Estimated Value: $315,000 - $340,000
4
Beds
3
Baths
1,842
Sq Ft
$178/Sq Ft
Est. Value
About This Home
This home is located at 2032 Brittani Cir, Canal Fulton, OH 44614 and is currently estimated at $327,956, approximately $178 per square foot. 2032 Brittani Cir is a home located in Stark County with nearby schools including W.S. Stinson Elementary School, Northwest Primary School, and Northwest Middle School.
Ownership History
Date
Name
Owned For
Owner Type
Purchase Details
Closed on
Jan 5, 2001
Sold by
Dutch Heritage Homes Inc
Bought by
Stacy Tomas D and Stacy Shannon M
Current Estimated Value
Home Financials for this Owner
Home Financials are based on the most recent Mortgage that was taken out on this home.
Original Mortgage
$168,151
Outstanding Balance
$62,716
Interest Rate
7.69%
Mortgage Type
Purchase Money Mortgage
Estimated Equity
$265,240
Purchase Details
Closed on
Mar 8, 2000
Sold by
Schalmo Properties Inc
Bought by
Dutch Heritage Homes Inc
Home Financials for this Owner
Home Financials are based on the most recent Mortgage that was taken out on this home.
Original Mortgage
$27,920
Interest Rate
8.13%
Mortgage Type
Purchase Money Mortgage
Create a Home Valuation Report for This Property
The Home Valuation Report is an in-depth analysis detailing your home's value as well as a comparison with similar homes in the area
Home Values in the Area
Average Home Value in this Area
Purchase History
| Date | Buyer | Sale Price | Title Company |
|---|---|---|---|
| Stacy Tomas D | $186,900 | -- | |
| Dutch Heritage Homes Inc | $34,900 | -- |
Source: Public Records
Mortgage History
| Date | Status | Borrower | Loan Amount |
|---|---|---|---|
| Open | Stacy Tomas D | $168,151 | |
| Previous Owner | Dutch Heritage Homes Inc | $27,920 | |
| Closed | Dutch Heritage Homes Inc | $8,725 |
Source: Public Records
Tax History Compared to Growth
Tax History
| Year | Tax Paid | Tax Assessment Tax Assessment Total Assessment is a certain percentage of the fair market value that is determined by local assessors to be the total taxable value of land and additions on the property. | Land | Improvement |
|---|---|---|---|---|
| 2025 | $2,129 | $114,740 | $22,510 | $92,230 |
| 2024 | -- | $114,740 | $22,510 | $92,230 |
| 2023 | $2,933 | $76,410 | $19,040 | $57,370 |
| 2022 | $2,958 | $76,410 | $19,040 | $57,370 |
| 2021 | $2,967 | $76,410 | $19,040 | $57,370 |
| 2020 | $2,384 | $57,760 | $14,180 | $43,580 |
| 2019 | $2,411 | $57,760 | $14,180 | $43,580 |
| 2018 | $2,469 | $57,760 | $14,180 | $43,580 |
| 2017 | $2,464 | $55,240 | $12,990 | $42,250 |
| 2016 | $2,490 | $55,240 | $12,990 | $42,250 |
| 2015 | $2,476 | $56,010 | $12,990 | $43,020 |
| 2014 | $400 | $50,720 | $11,760 | $38,960 |
| 2013 | $1,210 | $50,720 | $11,760 | $38,960 |
Source: Public Records
Map
Nearby Homes
- 872 Sandlewood Dr NW
- 2101 Livingston Dr
- 782 Beverly Ave
- 764 Chris Cir
- 707 Parkview Ave
- 1808 Pauli St
- 919 Baffin Dr
- 921 Cabot Dr
- 915 Shackleton Dr
- 1719 Bruce St
- 765 Longview Ave
- 537 E Lakewood Dr
- Ballenger w/ Basement Plan at Heritage Village
- Allegheny w/ Basement Plan at Heritage Village
- Hudson w/ Basement Plan at Heritage Village
- Columbia w/ Basement Plan at Heritage Village
- 12347 Stover Farm Dr NW
- 223 High St SE
- 8550 Cherryridge Ave NW
- 360 Locust St N
- 2024 Brittani Cir
- 2031 Brittani Cir
- 2025 Courtney Cir
- 2016 Brittani Cir
- 2023 Brittani Cir
- 2033 Courtney Cir
- 2015 Brittani Cir
- 2017 Courtney Cir
- 2008 Brittani Cir
- 2034 Courtney Cir
- 2007 Brittani Cir
- 965 Colonial Ave
- 2026 Courtney Cir
- 2018 Courtney Cir
- 2029 Dan Ave
- 927 Colonial Ave
- 950 Colonial Ave
- 2010 Courtney Cir
- 960 Colonial Ave
- 940 Colonial Ave