2032 E Lake Bluff Place Draper, UT 84020
Estimated Value: $1,284,000 - $1,547,624
4
Beds
3
Baths
4,452
Sq Ft
$324/Sq Ft
Est. Value
About This Home
This home is located at 2032 E Lake Bluff Place, Draper, UT 84020 and is currently estimated at $1,442,208, approximately $323 per square foot. 2032 E Lake Bluff Place is a home located in Utah County with nearby schools including Ridgeline Elementary School, Timberline Middle School, and Lone Peak High School.
Ownership History
Date
Name
Owned For
Owner Type
Purchase Details
Closed on
Nov 15, 2019
Sold by
Barrett Dennis P and Barrett Coylynn
Bought by
Barrett Dennis P and Joint Barett Joint
Current Estimated Value
Purchase Details
Closed on
Sep 13, 2019
Sold by
Barrett Dennis P
Bought by
Barrett Dennis P and Barrett Coylynn
Purchase Details
Closed on
Sep 26, 2018
Sold by
Barrett Dennis P
Bought by
Barrett Dennis P and Barrett Coylynn
Purchase Details
Closed on
Sep 25, 2018
Sold by
Power Perry J and Power Patricia Ann
Bought by
Barrett Dennis P
Purchase Details
Closed on
May 20, 2016
Sold by
Hulse Rodney Clarence and Hulse Rodney C
Bought by
Power Perry J and Power Patricia Ann
Purchase Details
Closed on
Mar 5, 2007
Sold by
Suncrest Llc
Bought by
Hulse Rodney C and Hulse Cathryn J
Create a Home Valuation Report for This Property
The Home Valuation Report is an in-depth analysis detailing your home's value as well as a comparison with similar homes in the area
Home Values in the Area
Average Home Value in this Area
Purchase History
| Date | Buyer | Sale Price | Title Company |
|---|---|---|---|
| Barrett Dennis P | -- | None Available | |
| Barrett Dennis P | -- | None Available | |
| Barrett Dennis P | -- | Cottonwood Title Ins Agency | |
| Barrett Dennis P | -- | Cottonwood Title Ins Agency | |
| Power Perry J | -- | None Available | |
| Hulse Rodney C | -- | Talon Group |
Source: Public Records
Tax History Compared to Growth
Tax History
| Year | Tax Paid | Tax Assessment Tax Assessment Total Assessment is a certain percentage of the fair market value that is determined by local assessors to be the total taxable value of land and additions on the property. | Land | Improvement |
|---|---|---|---|---|
| 2025 | $5,930 | $714,175 | $472,000 | $826,500 |
| 2024 | $5,491 | $621,665 | $0 | $0 |
| 2023 | $5,491 | $620,235 | $0 | $0 |
| 2022 | $5,309 | $584,925 | $0 | $0 |
| 2021 | $4,632 | $799,600 | $342,600 | $457,000 |
| 2020 | $4,336 | $731,100 | $274,100 | $457,000 |
| 2019 | $4,180 | $731,100 | $274,100 | $457,000 |
| 2018 | $4,094 | $679,700 | $256,300 | $423,400 |
| 2017 | $3,255 | $287,595 | $0 | $0 |
| 2016 | $2,361 | $195,500 | $0 | $0 |
| 2015 | $2,087 | $162,900 | $0 | $0 |
| 2014 | $1,655 | $135,100 | $0 | $0 |
Source: Public Records
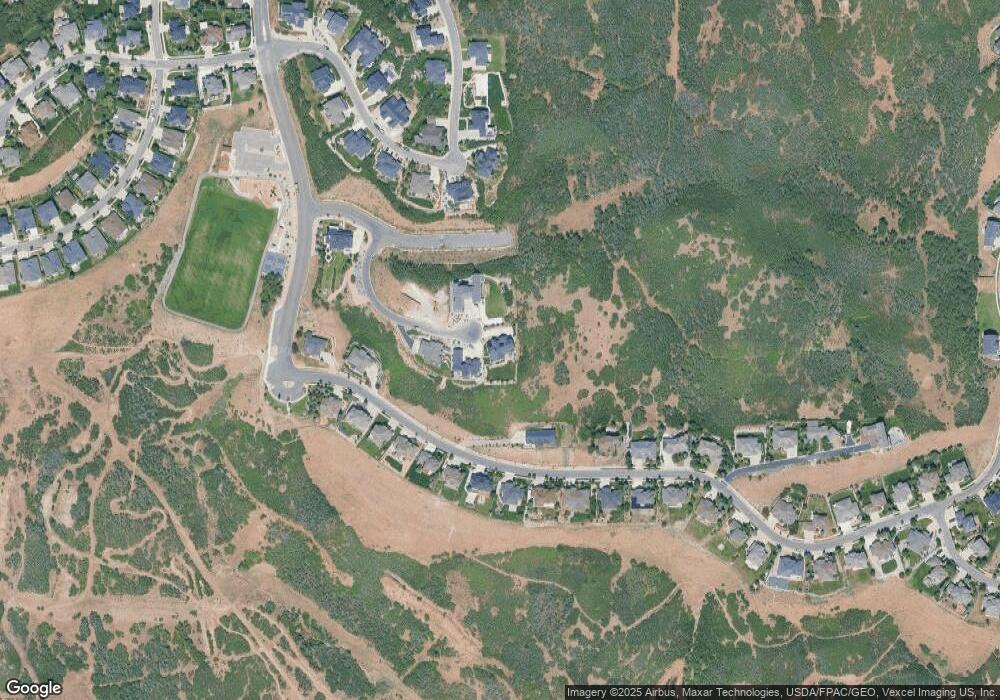
Map
Nearby Homes
- 15211 S Tall Woods Dr Unit 24
- 2087 Eagle Crest Dr
- 2116 Falcon Ridge Dr
- 1871 E Vista Ridge Ct
- 1870 E Oak Bend Dr
- 15151 S Eagle Chase Dr
- 1795 E Walnut Grove Dr
- 15095 Alder Glen Ln
- 15194 S Eagle Crest Dr Unit 139
- 15184 S Eagle Crest Dr
- 15057 S Winged Bluff Ln
- 14971 S Winged Bluff Ln
- 14997 Eagle Crest Dr
- 14902 S Saddle Leaf Ct
- 2151 E Village Vista Dr
- 14820 S Shadow Grove Ct
- 15574 S Mercer Ct
- 15574 S Mercer Ct Unit 502
- 14848 S Seven Oaks Ln
- 15008 S Springtime Rd
- 2032 E Lake Bluff Place Unit 54
- 2026 E Lake Bluff Place
- 2026 E Lake Bluff Place Unit 55
- 2033 E Lake Bluff Place Unit 53
- 2020 E Lake Bluff Place Unit 56
- 2027 E Lake Bluff Place
- 2019 E Eagle Crest Dr Unit 58
- 2001 E Eagle Crest Dr Unit 58
- 2021 E Lake Bluff Place Unit 51
- 1962 E Eagle Crest Dr
- 1962 Eagle Crest Dr
- 1962 Eagle Crest Dr Unit 29
- 1956 E Eagle Crest Dr
- 1968 E Eagle Crest Dr
- 1956 Eagle Crest Dr
- 1956 Eagle Crest Dr Unit 28
- 1937 Eagle Crest Dr
- 1968 Eagle Crest Dr
- 1968 Eagle Crest Dr Unit 30
- 1937 E Eagle Crest Dr