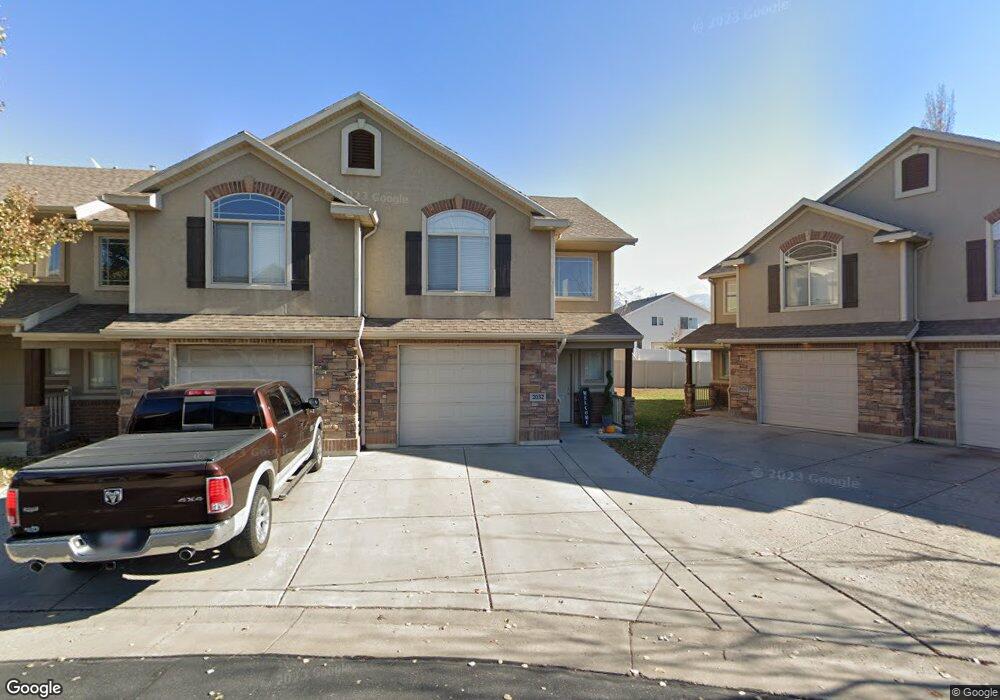
2032 Evans Cove Loop Layton, UT 84041
Estimated Value: $351,000 - $380,000
3
Beds
3
Baths
1,495
Sq Ft
$247/Sq Ft
Est. Value
About This Home
This home is located at 2032 Evans Cove Loop, Layton, UT 84041 and is currently estimated at $368,805, approximately $246 per square foot. 2032 Evans Cove Loop is a home located in Davis County with nearby schools including Lincoln Elementary School, North Layton Junior High School, and Northridge High School.
Ownership History
Date
Name
Owned For
Owner Type
Purchase Details
Closed on
Aug 19, 2019
Sold by
Duff Brian and Duff Vicki
Bought by
Duff Brian Thomas and Duff Vicki Sue
Current Estimated Value
Purchase Details
Closed on
Dec 21, 2012
Sold by
Cox Jamie E
Bought by
Duff Brian and Duff Vicki
Home Financials for this Owner
Home Financials are based on the most recent Mortgage that was taken out on this home.
Original Mortgage
$102,198
Outstanding Balance
$18,000
Interest Rate
2.62%
Mortgage Type
New Conventional
Estimated Equity
$350,805
Purchase Details
Closed on
Feb 2, 2006
Sold by
Nilson & Co Inc
Bought by
Cox Jamie E
Home Financials for this Owner
Home Financials are based on the most recent Mortgage that was taken out on this home.
Original Mortgage
$112,720
Interest Rate
6.21%
Mortgage Type
Fannie Mae Freddie Mac
Create a Home Valuation Report for This Property
The Home Valuation Report is an in-depth analysis detailing your home's value as well as a comparison with similar homes in the area
Home Values in the Area
Average Home Value in this Area
Purchase History
We collect this data history from publicly available records. To have your information removed, we recommend requesting removal directly through your county’s website.
| Date | Buyer | Sale Price | Title Company |
|---|---|---|---|
| Duff Brian Thomas | -- | None Available | |
| Duff Brian | -- | Bonneville Superior Title Co | |
| Cox Jamie E | -- | Bonneville Title Company |
Source: Public Records
Mortgage History
We collect this data history from publicly available records. To have your information removed, we recommend requesting removal directly through your county’s website.
| Date | Status | Borrower | Loan Amount |
|---|---|---|---|
| Open | Duff Brian | $102,198 | |
| Previous Owner | Cox Jamie E | $112,720 |
Source: Public Records
Tax History
| Year | Tax Paid | Tax Assessment Tax Assessment Total Assessment is a certain percentage of the fair market value that is determined by local assessors to be the total taxable value of land and additions on the property. | Land | Improvement |
|---|---|---|---|---|
| 2025 | $1,787 | $187,550 | $68,200 | $119,350 |
| 2024 | $1,737 | $183,700 | $52,250 | $131,450 |
| 2023 | $1,813 | $185,900 | $50,050 | $135,850 |
| 2022 | $1,831 | $337,000 | $83,000 | $254,000 |
| 2021 | $1,676 | $253,000 | $69,000 | $184,000 |
| 2020 | $1,554 | $225,000 | $51,000 | $174,000 |
| 2019 | $1,544 | $219,000 | $49,000 | $170,000 |
| 2018 | $1,369 | $195,000 | $49,000 | $146,000 |
| 2016 | $1,161 | $85,250 | $26,950 | $58,300 |
| 2015 | $1,123 | $78,320 | $26,950 | $51,370 |
| 2014 | $1,124 | $80,121 | $18,333 | $61,788 |
| 2013 | -- | $74,946 | $15,400 | $59,546 |
Source: Public Records
Map
Nearby Homes
- 2036 Evans Cove Loop
- 2036 Evans Cove Loop Unit 6
- 2042 Evans Cove Loop
- 2030 Evans Cove Loop
- 2028 Evans Cove Loop
- 2026 Evans Cove Loop
- 2033 N 50 W
- 2024 Evans Cove Loop
- 2054 Evans Cove Loop
- 2049 N 50 W
- 2037 Evans Cove Loop
- 2037 Evans Cove Loop Unit 68
- 2017 N 50 W
- 2043 Evans Cove Loop
- 2043 Evans Cove Loop Unit 67
- 2047 Evans Cove Loop
- 2062 Evans Cove Loop
- 2051 Evans Cove Loop
- 2055 Evans Cove Loop
- 2055 Evans Cove Loop
Your Personal Tour Guide
Ask me questions while you tour the home.