Estimated Value: $98,691 - $147,000
--
Bed
1
Bath
804
Sq Ft
$154/Sq Ft
Est. Value
About This Home
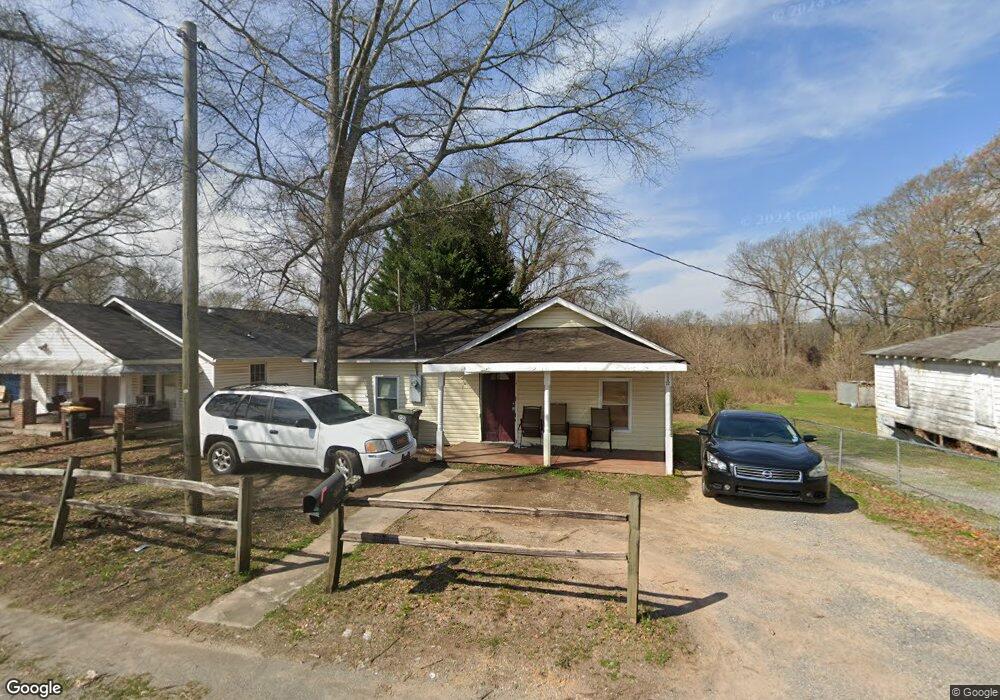
This home is located at 2032 Maple Ave SW, Rome, GA 30161 and is currently estimated at $124,173, approximately $154 per square foot. 2032 Maple Ave SW is a home located in Floyd County with nearby schools including Dan McCarty Middle School, Rome High School, and Montessori School of Rome.
Ownership History
Date
Name
Owned For
Owner Type
Purchase Details
Closed on
Dec 28, 2012
Sold by
Dudley John P and Dudley J Jim G
Bought by
J Harris Properties Llc
Current Estimated Value
Purchase Details
Closed on
Aug 21, 2008
Sold by
Clonts John
Bought by
Dudley John P and Dudley Jim G
Purchase Details
Closed on
Feb 22, 2005
Sold by
Clonts John
Bought by
Clonts Heather B
Purchase Details
Closed on
Jun 19, 2002
Sold by
Davis Davis J and Davis Mary M
Bought by
Clonts John
Purchase Details
Closed on
Mar 28, 1986
Sold by
Davis J Weldon Davis J Weldon Davis
Bought by
Davis Davis J and Davis Mary M
Purchase Details
Closed on
Jan 20, 1976
Sold by
Ponder Grace Ponder Grace Ponder Grac
Bought by
Davis J Weldon Davis J Weldon Davis
Purchase Details
Closed on
Jan 1, 1901
Bought by
Ponder Grace Ponder Grace Ponder Gr
Create a Home Valuation Report for This Property
The Home Valuation Report is an in-depth analysis detailing your home's value as well as a comparison with similar homes in the area
Home Values in the Area
Average Home Value in this Area
Purchase History
| Date | Buyer | Sale Price | Title Company |
|---|---|---|---|
| J Harris Properties Llc | -- | -- | |
| Dudley John P | $44,000 | -- | |
| Clonts Heather B | -- | -- | |
| Clonts John | $14,000 | -- | |
| Davis Davis J | -- | -- | |
| Davis J Weldon Davis J Weldon Davis | $4,300 | -- | |
| Ponder Grace Ponder Grace Ponder Gr | -- | -- |
Source: Public Records
Tax History Compared to Growth
Tax History
| Year | Tax Paid | Tax Assessment Tax Assessment Total Assessment is a certain percentage of the fair market value that is determined by local assessors to be the total taxable value of land and additions on the property. | Land | Improvement |
|---|---|---|---|---|
| 2024 | $1,139 | $29,352 | $4,400 | $24,952 |
| 2023 | $944 | $26,897 | $4,000 | $22,897 |
| 2022 | $807 | $22,118 | $3,200 | $18,918 |
| 2021 | $747 | $20,141 | $3,200 | $16,941 |
| 2020 | $690 | $18,440 | $2,500 | $15,940 |
| 2019 | $646 | $17,439 | $2,500 | $14,939 |
| 2018 | $609 | $16,463 | $2,500 | $13,963 |
| 2017 | $587 | $15,863 | $2,500 | $13,363 |
| 2016 | $572 | $15,413 | $2,480 | $12,933 |
| 2015 | $540 | $15,413 | $2,480 | $12,933 |
| 2014 | $540 | $15,413 | $2,480 | $12,933 |
Source: Public Records
Map
Nearby Homes
- 2014 Maple Ave SW
- 7 Willingham St SW
- 14 Clover St SW
- 2108 Maple Ave SW
- 304 E 19th St SW
- 111 Hosea St SW
- 1901 Hull Ave SW
- 1705 Olmstead St SW
- 000 E Oglethorpe Hwy
- 0 Martha Berry Hwy Unit 7525627
- 0 Martha Berry Hwy Unit 7614774
- 0 Martha Berry Hwy Unit 10563404
- 414 E 17th St SW
- 107 E Linden St SE
- 39 E 16th St SW
- 2501 Maple Rd SE
- 4 E 15th St SW
- 2508 Maple Rd SE
- 106 E 14th St SW
- 2107 Rockmart Rd SE
- 2030 Maple Ave SW
- 2034 Maple Ave SW
- 2028 Maple Ave SW
- 2026 Maple Ave SW
- 2024 Maple Ave SW
- 2025 Maple Ave SW
- 2022 Maple Ave SW
- 2018 Maple Ave SW
- 3 Willingham St SW
- 3 Worsham St SW
- 4 Worsham St SW
- 2021 Maple Ave SW
- 2020 Maple Ave SW
- 2020 Maple Ave SW
- 2020 Maple Ave SW
- 2020 Maple Ave SW
- 2104 Maple Ave SW
- 2016 Maple Ave SW
- 5 Willingham St SW
- 5 Worsham St SW