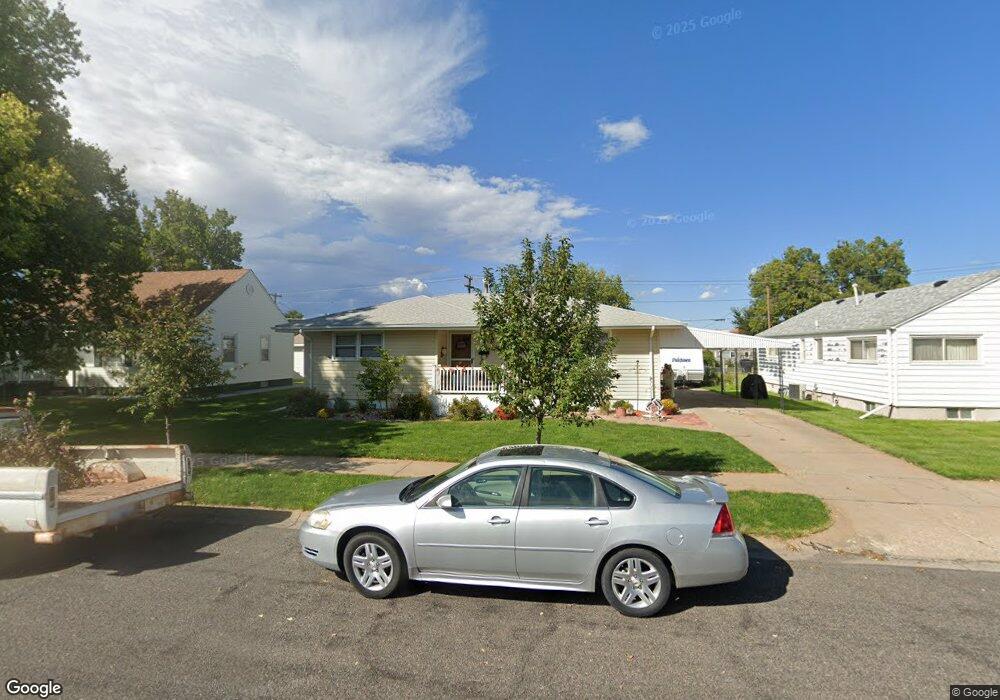
2032 Maple St Sidney, NE 69162
Estimated Value: $143,688 - $164,000
3
Beds
1
Bath
1,242
Sq Ft
$125/Sq Ft
Est. Value
About This Home
This home is located at 2032 Maple St, Sidney, NE 69162 and is currently estimated at $155,172, approximately $124 per square foot. 2032 Maple St is a home located in Cheyenne County with nearby schools including Central Elementary School, South Ward Elementary School, and North Ward Elementary School.
Ownership History
Date
Name
Owned For
Owner Type
Purchase Details
Closed on
Jun 14, 2019
Sold by
Spearow Doris A
Bought by
Plaster Mark D and Plaster Ruth A
Current Estimated Value
Purchase Details
Closed on
May 6, 2015
Sold by
Quentin L Quentin L
Bought by
Shaw Robert M and Smith Monica L
Purchase Details
Closed on
Sep 27, 2011
Sold by
Spearow Doris A
Bought by
Cranmore Quentin L
Home Financials for this Owner
Home Financials are based on the most recent Mortgage that was taken out on this home.
Original Mortgage
$121,172
Interest Rate
4.28%
Purchase Details
Closed on
Jun 30, 2011
Sold by
White Sandra Ann and White John W
Bought by
Spearow Doris A
Create a Home Valuation Report for This Property
The Home Valuation Report is an in-depth analysis detailing your home's value as well as a comparison with similar homes in the area
Home Values in the Area
Average Home Value in this Area
Purchase History
| Date | Buyer | Sale Price | Title Company |
|---|---|---|---|
| Plaster Mark D | $100,500 | -- | |
| Shaw Robert M | -- | -- | |
| Cranmore Quentin L | -- | -- | |
| Spearow Doris A | -- | -- |
Source: Public Records
Mortgage History
| Date | Status | Borrower | Loan Amount |
|---|---|---|---|
| Previous Owner | Cranmore Quentin L | $121,172 |
Source: Public Records
Tax History
| Year | Tax Paid | Tax Assessment Tax Assessment Total Assessment is a certain percentage of the fair market value that is determined by local assessors to be the total taxable value of land and additions on the property. | Land | Improvement |
|---|---|---|---|---|
| 2025 | $1,886 | $105,865 | $12,855 | $93,010 |
| 2024 | $1,745 | $97,124 | $11,794 | $85,330 |
| 2023 | $2,569 | $113,592 | $11,794 | $101,798 |
| 2022 | $2,399 | $103,504 | $11,794 | $91,710 |
| 2021 | $2,404 | $102,814 | $11,794 | $91,020 |
| 2020 | $2,164 | $92,707 | $10,257 | $82,450 |
| 2019 | $2,072 | $89,417 | $10,257 | $79,160 |
| 2018 | $2,358 | $103,967 | $11,920 | $92,047 |
| 2017 | $2,704 | $120,892 | $13,861 | $107,031 |
| 2016 | $2,586 | $120,892 | $13,861 | $107,031 |
| 2015 | $2,616 | $120,892 | $13,861 | $107,031 |
| 2014 | $2,715 | $121,112 | $13,861 | $107,251 |
Source: Public Records
Map
Nearby Homes
- 1539 Jackson St
- 1905 Sidney Draw Rd
- 1229 Linden St
- 1220 Quince St
- 935 Illinois St
- 2446 El Rancho Rd
- 539 Keller Dr
- 829 Olsen Dr
- 1362 Mission Dr
- 2659 Verde Ln
- 801 Deervalley Dr
- 801 Deer Valley Dr
- 10562 Road 22
- 11732 Road 32nd Unit Sidney NE 69162
- 11732 Road 32
- 0 Tbd Cr 78 Unit 11679084
- 0 Tbd Cr 78 Unit 26703132
- 0 Tbd Cr 78 Unit 26703131
- 0 Tbd Cr 78 Unit 11679082
- 4674 Highway 385
Your Personal Tour Guide
Ask me questions while you tour the home.