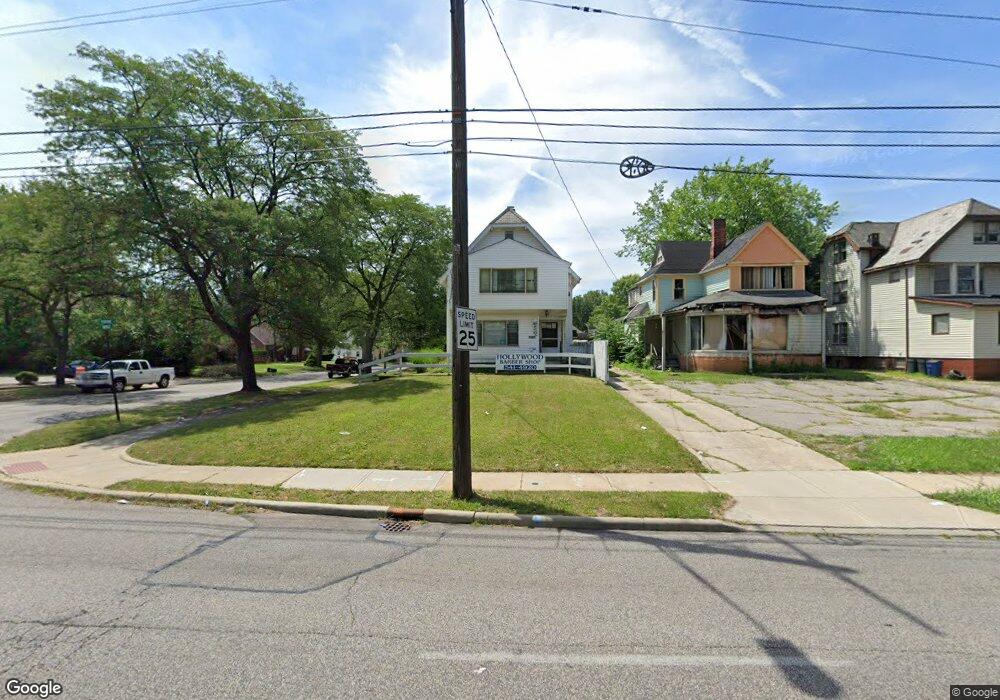
2032 Noble Rd East Cleveland, OH 44112
Estimated Value: $136,892
--
Bed
1
Bath
2,214
Sq Ft
$62/Sq Ft
Est. Value
About This Home
This home is located at 2032 Noble Rd, East Cleveland, OH 44112 and is currently estimated at $136,892, approximately $61 per square foot. 2032 Noble Rd is a home located in Cuyahoga County with nearby schools including A.C. Jones Health Professions Magnet Academy, Shaw High School, and Apex Academy.
Ownership History
Date
Name
Owned For
Owner Type
Purchase Details
Closed on
Jun 15, 2018
Sold by
Carter Mary S
Bought by
Olowu Ayoyunde
Current Estimated Value
Purchase Details
Closed on
Jul 13, 2015
Sold by
Carter Mary Pearl Sims and Carter Mary S
Bought by
Carter Mary S and Mary S Carter Revocable Living Trust
Purchase Details
Closed on
Dec 19, 2013
Sold by
Carter Mary Pearl Sims
Bought by
Carter Mary Pearl Sims
Purchase Details
Closed on
Jun 29, 2000
Sold by
Sims William I
Bought by
Sims William Isaac and William Isaac Sims Revocable Trust
Purchase Details
Closed on
Jun 2, 1997
Sold by
William Mitchell Trst
Bought by
Woodin Freddie L
Purchase Details
Closed on
Jul 12, 1985
Sold by
Stewart Rita E
Bought by
Bond Roger
Purchase Details
Closed on
Jan 19, 1978
Sold by
Bryant Alma R
Bought by
Stewart Rita E
Purchase Details
Closed on
Jan 1, 1975
Bought by
Bryant Alma R
Create a Home Valuation Report for This Property
The Home Valuation Report is an in-depth analysis detailing your home's value as well as a comparison with similar homes in the area
Home Values in the Area
Average Home Value in this Area
Purchase History
| Date | Buyer | Sale Price | Title Company |
|---|---|---|---|
| Olowu Ayoyunde | $20,000 | Chicago Title Ins | |
| Carter Mary S | -- | Attorney | |
| Carter Mary Pearl Sims | -- | Attorney | |
| Sims William Isaac | -- | -- | |
| Woodin Freddie L | $59,900 | -- | |
| Bond Roger | $45,000 | -- | |
| Stewart Rita E | $45,900 | -- | |
| Bryant Alma R | -- | -- |
Source: Public Records
Tax History Compared to Growth
Tax History
| Year | Tax Paid | Tax Assessment Tax Assessment Total Assessment is a certain percentage of the fair market value that is determined by local assessors to be the total taxable value of land and additions on the property. | Land | Improvement |
|---|---|---|---|---|
| 2024 | $1,565 | $14,455 | $7,350 | $7,105 |
| 2023 | $758 | $6,860 | $3,430 | $3,430 |
| 2022 | $756 | $6,860 | $3,430 | $3,430 |
| 2021 | $751 | $6,860 | $3,430 | $3,430 |
| 2020 | $813 | $7,000 | $3,500 | $3,500 |
| 2019 | $1,387 | $36,200 | $10,800 | $25,400 |
| 2018 | $1,557 | $12,670 | $3,780 | $8,890 |
| 2017 | $1,749 | $12,670 | $3,780 | $8,890 |
| 2016 | $1,733 | $12,670 | $3,780 | $8,890 |
| 2015 | $1,968 | $12,670 | $3,780 | $8,890 |
| 2014 | $1,968 | $15,830 | $4,730 | $11,100 |
Source: Public Records
Map
Nearby Homes
- 817 Helmsdale Rd
- 825 Helmsdale Rd
- 861 Caledonia Ave
- 841 Helmsdale Rd
- 828 Nela View Rd
- 833 Nela View Rd
- 839 Nela View Rd
- 885 Helmsdale Rd
- 935 Ravine Dr
- 16208 Greyton Rd
- 907 Nela View Rd
- 931 Helmsdale Rd
- 939 Helmsdale Rd
- 916 Whitby Rd
- 945 Dresden Rd
- 936 Dresden Rd
- 877 Woodview Rd Unit 101
- 901 Woodview Rd
- 2121 Alton Rd
- 965 Whitby Rd
- 2028 Noble Rd
- 2022 Noble Rd
- 16019 Ravine Dr
- 16015 Ravine Dr
- 16022 Ravine Dr
- 16026 Neladale Rd
- 16022 Neladale Rd
- 16018 Ravine Dr
- 16018 Neladale Rd
- 16007 Ravine Dr
- 16002 Ravine Dr
- 16014 Ravine Dr
- 16014 Neladale Rd
- 2058 Noble Rd
- 16010 Neladale Rd
- 16008 Ravine Dr
- 15999 Ravine Dr
- 2062 Noble Rd
- 16006 Neladale Rd
- 2004 Noble Rd