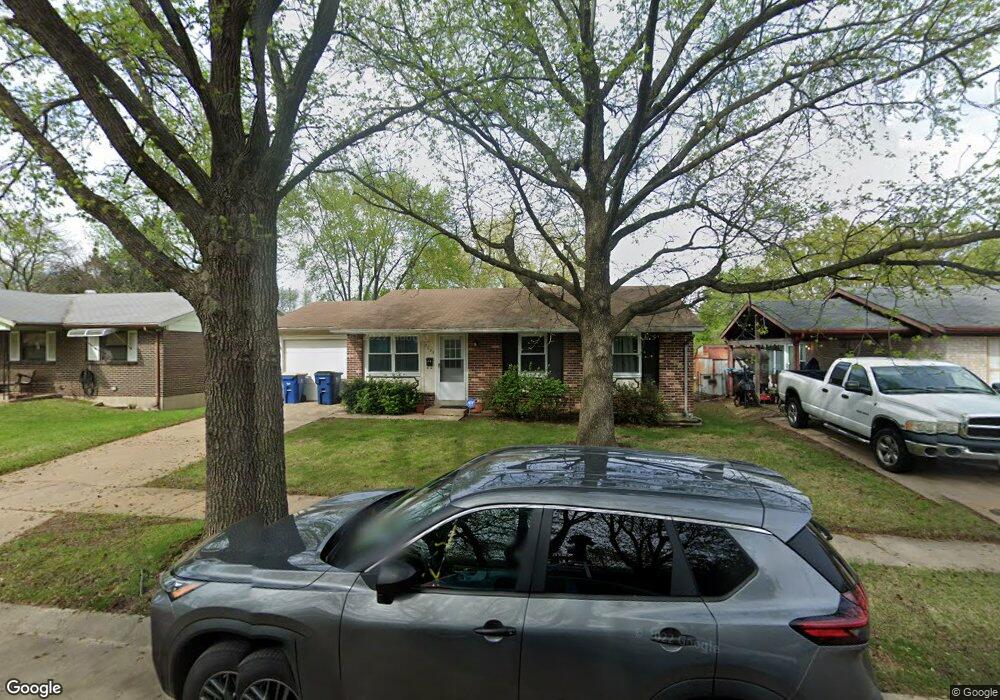
2033 Foggy Bottom Dr Florissant, MO 63031
Estimated Value: $168,000 - $190,000
3
Beds
1
Bath
1,015
Sq Ft
$173/Sq Ft
Est. Value
About This Home
This home is located at 2033 Foggy Bottom Dr, Florissant, MO 63031 and is currently estimated at $175,558, approximately $172 per square foot. 2033 Foggy Bottom Dr is a home located in St. Louis County with nearby schools including Lusher Elementary School, Northwest Middle School, and Hazelwood West High School.
Ownership History
Date
Name
Owned For
Owner Type
Purchase Details
Closed on
Apr 24, 2012
Sold by
New Vision Group Llc
Bought by
Aleli Group Llc
Current Estimated Value
Purchase Details
Closed on
Oct 26, 2011
Sold by
Secretary Of Housing & Urban Development
Bought by
New Vision Group Llc
Purchase Details
Closed on
Mar 7, 2011
Sold by
Gmac Mortgage Llc
Bought by
Secretary Of Housing & Urban Development
Purchase Details
Closed on
Feb 14, 2011
Sold by
Goodman Kerry A
Bought by
Gmac Mortgage Llc
Purchase Details
Closed on
Nov 13, 2003
Sold by
Ebel Michael Thomas
Bought by
Goodman Kerry A
Home Financials for this Owner
Home Financials are based on the most recent Mortgage that was taken out on this home.
Original Mortgage
$98,124
Interest Rate
5.93%
Mortgage Type
FHA
Create a Home Valuation Report for This Property
The Home Valuation Report is an in-depth analysis detailing your home's value as well as a comparison with similar homes in the area
Home Values in the Area
Average Home Value in this Area
Purchase History
| Date | Buyer | Sale Price | Title Company |
|---|---|---|---|
| Aleli Group Llc | $50,500 | None Available | |
| New Vision Group Llc | $37,000 | None Available | |
| Secretary Of Housing & Urban Development | $100,016 | None Available | |
| Gmac Mortgage Llc | $100,016 | None Available | |
| Goodman Kerry A | $98,900 | Capital Title |
Source: Public Records
Mortgage History
| Date | Status | Borrower | Loan Amount |
|---|---|---|---|
| Previous Owner | Goodman Kerry A | $98,124 |
Source: Public Records
Tax History Compared to Growth
Tax History
| Year | Tax Paid | Tax Assessment Tax Assessment Total Assessment is a certain percentage of the fair market value that is determined by local assessors to be the total taxable value of land and additions on the property. | Land | Improvement |
|---|---|---|---|---|
| 2025 | $2,136 | $28,650 | $5,320 | $23,330 |
| 2024 | $2,136 | $24,380 | $3,060 | $21,320 |
| 2023 | $2,133 | $24,380 | $3,060 | $21,320 |
| 2022 | $1,879 | $19,100 | $3,500 | $15,600 |
| 2021 | $1,852 | $19,100 | $3,500 | $15,600 |
| 2020 | $1,788 | $17,160 | $3,500 | $13,660 |
| 2019 | $1,761 | $17,160 | $3,500 | $13,660 |
| 2018 | $1,493 | $13,350 | $2,410 | $10,940 |
| 2017 | $1,492 | $13,350 | $2,410 | $10,940 |
| 2016 | $1,447 | $12,770 | $2,790 | $9,980 |
| 2015 | $1,417 | $12,770 | $2,790 | $9,980 |
| 2014 | $1,596 | $14,860 | $3,500 | $11,360 |
Source: Public Records
Map
Nearby Homes
- 2112 Millvalley Dr
- 1920 High Sun Dr
- 1885 High Sun Dr
- 2216 Foggy Bottom Dr
- 2314 Stoney End Ct
- 1863 High Sun Dr Unit 51863
- 2048 New Sun Dr
- 2112 New Sun Dr
- 2515 Flamingo Dr
- 1830 New Sun Ct
- 2106 Kingsford Dr
- 1380 Thrush Ln
- 2042 Farflung Dr
- 1920 Shackelford Rd
- 1834 Night Dr
- 2347 Farflung Dr
- 2540 Courtyard Place
- 1270 Bobolink Dr
- 2040 Splendor Dr
- 2618 Freemantle Dr
- 2023 Foggy Bottom Dr
- 2043 Foggy Bottom Dr
- 2013 Foggy Bottom Dr
- 2053 Foggy Bottom Dr
- 2128 Freestone Ct
- 2030 Foggy Bottom Dr
- 2020 Foggy Bottom Dr
- 2040 Foggy Bottom Dr
- 2003 Foggy Bottom Dr
- 2138 Freestone Ct
- 2123 Northern Limits Dr
- 2010 Foggy Bottom Dr
- 2050 Foggy Bottom Dr
- 2133 Northern Limits Dr
- 2060 Foggy Bottom Dr
- 2000 Foggy Bottom Dr
- 2148 Freestone Ct
- 2143 Northern Limits Dr
- 2070 Foggy Bottom Dr
- 2158 Freestone Ct