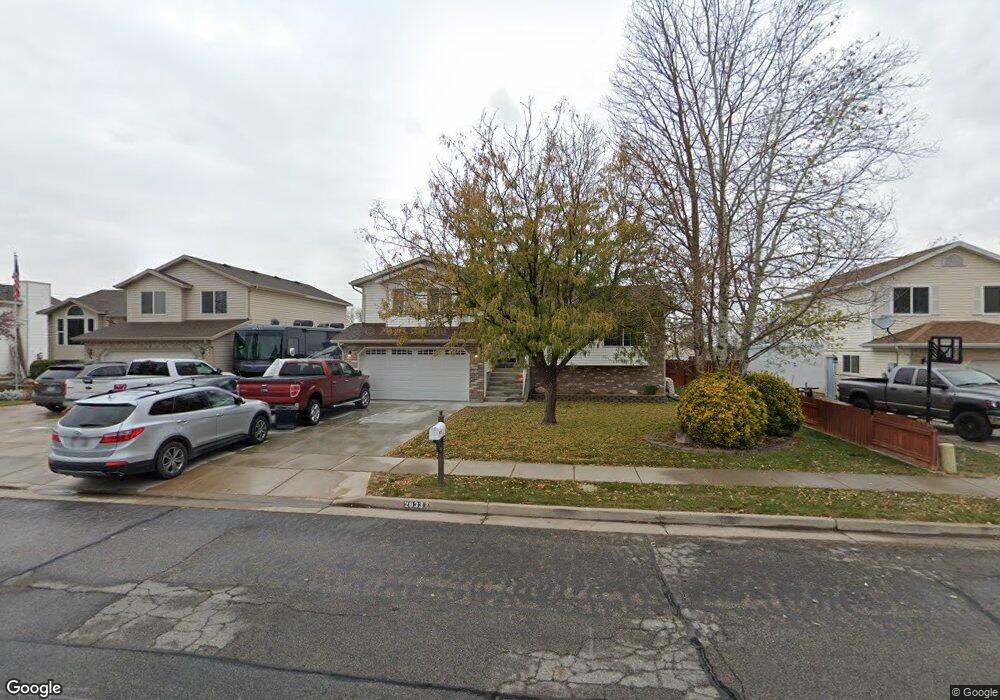
2033 N 950 W Clearfield, UT 84015
Estimated Value: $451,000 - $530,000
4
Beds
3
Baths
1,658
Sq Ft
$298/Sq Ft
Est. Value
About This Home
This home is located at 2033 N 950 W, Clearfield, UT 84015 and is currently estimated at $494,165, approximately $298 per square foot. 2033 N 950 W is a home located in Davis County with nearby schools including Fremont School, Sunset Junior High School, and Northridge High School.
Ownership History
Date
Name
Owned For
Owner Type
Purchase Details
Closed on
Feb 22, 2001
Sold by
Ropelato Scott R
Bought by
Ropelato Scott R and Ropelato Erin
Current Estimated Value
Home Financials for this Owner
Home Financials are based on the most recent Mortgage that was taken out on this home.
Original Mortgage
$96,000
Interest Rate
6.5%
Purchase Details
Closed on
Aug 26, 1996
Sold by
Higley & Higley Construction Inc
Bought by
Ropelato Scott R
Home Financials for this Owner
Home Financials are based on the most recent Mortgage that was taken out on this home.
Original Mortgage
$98,415
Interest Rate
8.23%
Mortgage Type
FHA
Create a Home Valuation Report for This Property
The Home Valuation Report is an in-depth analysis detailing your home's value as well as a comparison with similar homes in the area
Home Values in the Area
Average Home Value in this Area
Purchase History
| Date | Buyer | Sale Price | Title Company |
|---|---|---|---|
| Ropelato Scott R | -- | Mountain View Title & Escrow | |
| Ropelato Scott R | -- | Bonneville Title Company Inc |
Source: Public Records
Mortgage History
| Date | Status | Borrower | Loan Amount |
|---|---|---|---|
| Closed | Ropelato Scott R | $96,000 | |
| Closed | Ropelato Scott R | $98,415 |
Source: Public Records
Tax History
| Year | Tax Paid | Tax Assessment Tax Assessment Total Assessment is a certain percentage of the fair market value that is determined by local assessors to be the total taxable value of land and additions on the property. | Land | Improvement |
|---|---|---|---|---|
| 2025 | $2,866 | $275,550 | $92,344 | $183,206 |
| 2024 | $2,765 | $267,300 | $101,299 | $166,001 |
| 2023 | $2,494 | $446,000 | $115,615 | $330,385 |
| 2022 | $2,663 | $263,450 | $70,281 | $193,169 |
| 2021 | $2,426 | $356,000 | $88,730 | $267,270 |
| 2020 | $2,114 | $307,000 | $75,792 | $231,208 |
| 2019 | $2,100 | $298,000 | $87,834 | $210,166 |
| 2018 | $875 | $122,000 | $74,092 | $47,908 |
| 2016 | $1,526 | $109,835 | $28,935 | $80,900 |
| 2015 | $1,192 | $81,565 | $28,935 | $52,630 |
| 2014 | $1,106 | $76,914 | $28,935 | $47,979 |
| 2013 | -- | $81,102 | $27,143 | $53,959 |
Source: Public Records
Map
Nearby Homes
Your Personal Tour Guide
Ask me questions while you tour the home.