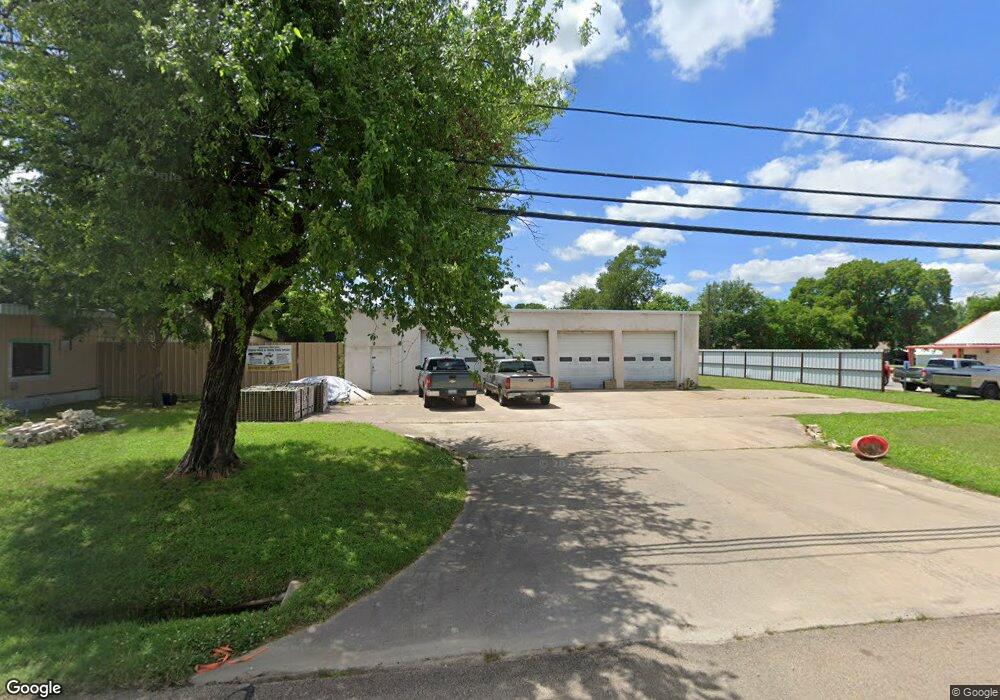
2033 N Center St Bonham, TX 75418
Estimated Value: $149,527
--
Bed
--
Bath
1,992
Sq Ft
$75/Sq Ft
Est. Value
About This Home
This home is located at 2033 N Center St, Bonham, TX 75418 and is currently priced at $149,527, approximately $75 per square foot. 2033 N Center St is a home located in Fannin County with nearby schools including Finley-Oates Elementary School, LH Rather Jr High School, and Morning Star Academy.
Ownership History
Date
Name
Owned For
Owner Type
Purchase Details
Closed on
Jun 18, 2019
Sold by
Weemes Investments Llc
Bought by
Hernandez Eloy Guerrero
Current Estimated Value
Home Financials for this Owner
Home Financials are based on the most recent Mortgage that was taken out on this home.
Original Mortgage
$83,300
Outstanding Balance
$72,936
Interest Rate
4.1%
Mortgage Type
Commercial
Purchase Details
Closed on
Jan 30, 2018
Sold by
Weemes Richard B and Weemes Robin M
Bought by
Weemes Investments Llc
Home Financials for this Owner
Home Financials are based on the most recent Mortgage that was taken out on this home.
Original Mortgage
$45,000
Interest Rate
3.99%
Mortgage Type
New Conventional
Purchase Details
Closed on
Feb 21, 1995
Sold by
Lovelace Ray
Bought by
Ray Lovelace Management Trust
Create a Home Valuation Report for This Property
The Home Valuation Report is an in-depth analysis detailing your home's value as well as a comparison with similar homes in the area
Home Values in the Area
Average Home Value in this Area
Purchase History
| Date | Buyer | Sale Price | Title Company |
|---|---|---|---|
| Hernandez Eloy Guerrero | -- | Cole Title Co | |
| Weemes Investments Llc | -- | None Available | |
| Ray Lovelace Management Trust | -- | None Available |
Source: Public Records
Mortgage History
| Date | Status | Borrower | Loan Amount |
|---|---|---|---|
| Open | Hernandez Eloy Guerrero | $83,300 | |
| Previous Owner | Weemes Investments Llc | $45,000 |
Source: Public Records
Tax History Compared to Growth
Tax History
| Year | Tax Paid | Tax Assessment Tax Assessment Total Assessment is a certain percentage of the fair market value that is determined by local assessors to be the total taxable value of land and additions on the property. | Land | Improvement |
|---|---|---|---|---|
| 2025 | $4,057 | $203,320 | $115,450 | $87,870 |
| 2024 | $4,057 | $209,190 | $115,450 | $93,740 |
| 2023 | $4,232 | $214,620 | $115,450 | $99,170 |
| 2022 | $4,592 | $208,780 | $115,450 | $93,330 |
| 2021 | $2,809 | $111,160 | $32,200 | $78,960 |
| 2020 | $2,490 | $97,400 | $22,250 | $75,150 |
| 2019 | $2,611 | $98,250 | $22,250 | $76,000 |
| 2018 | $1,575 | $59,330 | $22,250 | $37,080 |
| 2017 | $1,408 | $55,090 | $22,250 | $32,840 |
| 2016 | $1,464 | $57,270 | $22,250 | $35,020 |
| 2015 | -- | $54,620 | $22,250 | $32,370 |
| 2014 | -- | $56,800 | $24,610 | $32,190 |
Source: Public Records
Map
Nearby Homes
- 2023 N Center St
- 0000 Texas 78
- 5354 S State Highway 78
- 108 Leslie St
- 1913 N Main St
- 000 S State Highway 78
- 2109 Island Bayou
- 200 Victory St
- 2108 Agnew St
- 253 Graham Ave
- 1905 Agnew St
- 1711 Oriental St
- 204 W Boyd St
- 606 Hunter St
- 400 Martin St
- 0000 S State Highway 78
- 408 Rainey St
- 1604 N Center St
- 1525 Franklin St
- 0000 Lee St
- 2029 N Center St
- 104 E Russell Ave
- 200 E Russell Ave
- 2026 N Main St
- 102 E Russell Ave
- TBD Albert Broadfoot St
- TBD Russell Ave
- 2020 N Main St
- 2024 N Main St
- 2018 N Main St
- 202 E Russell Ave
- 100 E Russell Ave
- 107 E Russell Ave
- 2022 N Center St
- 2021 N Center St
- 105 E Russell Ave
- 204 E Russell Ave
- 0000 N Center St
- 103 E Russell Ave