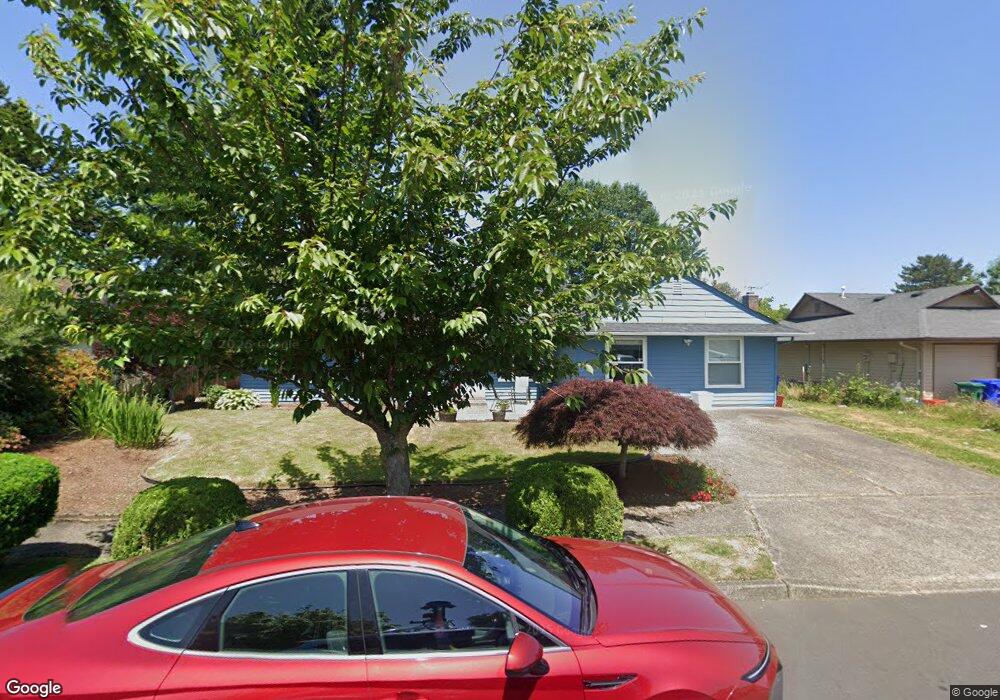
2033 NE 36th Ct Gresham, OR 97030
North Central NeighborhoodEstimated Value: $390,000 - $435,000
4
Beds
2
Baths
1,188
Sq Ft
$354/Sq Ft
Est. Value
About This Home
This home is located at 2033 NE 36th Ct, Gresham, OR 97030 and is currently estimated at $420,337, approximately $353 per square foot. 2033 NE 36th Ct is a home located in Multnomah County with nearby schools including Woodland Elementary School, Walt Morey Middle School, and Reynolds High School.
Ownership History
Date
Name
Owned For
Owner Type
Purchase Details
Closed on
Jun 3, 2019
Sold by
Salazar Romero Ysaias and Salazar Isaias
Bought by
Salazar Romero Ysaias
Current Estimated Value
Home Financials for this Owner
Home Financials are based on the most recent Mortgage that was taken out on this home.
Original Mortgage
$185,000
Outstanding Balance
$162,652
Interest Rate
4.2%
Mortgage Type
New Conventional
Estimated Equity
$257,685
Purchase Details
Closed on
May 27, 2003
Sold by
Bitz Fred A
Bought by
Salazar Isaias
Home Financials for this Owner
Home Financials are based on the most recent Mortgage that was taken out on this home.
Original Mortgage
$150,350
Interest Rate
5.75%
Mortgage Type
Purchase Money Mortgage
Purchase Details
Closed on
May 10, 1999
Sold by
Bennett Floyd
Bought by
Bitz Fred A and Bitz Heidi M
Home Financials for this Owner
Home Financials are based on the most recent Mortgage that was taken out on this home.
Original Mortgage
$126,125
Interest Rate
6.94%
Mortgage Type
FHA
Create a Home Valuation Report for This Property
The Home Valuation Report is an in-depth analysis detailing your home's value as well as a comparison with similar homes in the area
Home Values in the Area
Average Home Value in this Area
Purchase History
| Date | Buyer | Sale Price | Title Company |
|---|---|---|---|
| Salazar Romero Ysaias | -- | Wfg Title | |
| Salazar Isaias | $150,350 | Transnation | |
| Bitz Fred A | $127,000 | Chicago Title Insurance Co |
Source: Public Records
Mortgage History
| Date | Status | Borrower | Loan Amount |
|---|---|---|---|
| Open | Salazar Romero Ysaias | $185,000 | |
| Closed | Salazar Isaias | $150,350 | |
| Previous Owner | Bitz Fred A | $126,125 |
Source: Public Records
Tax History
| Year | Tax Paid | Tax Assessment Tax Assessment Total Assessment is a certain percentage of the fair market value that is determined by local assessors to be the total taxable value of land and additions on the property. | Land | Improvement |
|---|---|---|---|---|
| 2025 | $4,058 | $211,480 | -- | -- |
| 2024 | $3,840 | $205,330 | -- | -- |
| 2023 | $3,475 | $199,350 | $0 | $0 |
| 2022 | $3,389 | $193,550 | $0 | $0 |
| 2021 | $3,305 | $187,920 | $0 | $0 |
| 2020 | $3,092 | $182,450 | $0 | $0 |
| 2019 | $2,964 | $177,140 | $0 | $0 |
| 2018 | $2,934 | $171,990 | $0 | $0 |
| 2017 | $2,840 | $166,990 | $0 | $0 |
| 2016 | $2,716 | $162,130 | $0 | $0 |
Source: Public Records
Map
Nearby Homes
- 2516 SW 23rd St
- 3311 NE View Ave Unit 3313
- 24141 SE Oak St
- 2220 SW Brink Ave
- 2701 SW Latourell Place
- 2103 SW Stella Way
- 2797 NE Rene Ave Unit 25C
- 1431 SW 22nd St Unit 1433
- 2921 NE Rene Ave Unit 15B
- 1556 NE 27th Terrace
- 24066 NE Treehill Dr Unit 12
- 24044 NE Treehill Dr Unit 6
- 24046 NE Treehill Dr Unit 7
- 1548 SW Northstar Loop
- 2846 SW Faith Ct
- 23882 NE Treehill Dr Unit T3882
- 2320 NE Rene Ave
- 23932 NE Poplar Ct
- 1021 SW 24th St
- 3214 NE 29th St Unit 48
- 2047 NE 36th Ct
- 2029 NE 36th Ct
- 2052 NE 38th Dr
- 2086 NE 38th Dr
- 2086 NE 38 Dr
- 2038 NE 38th Dr
- 2030 NE 36th Ct
- 2015 NE 36th Ct
- 2024 NE 36th Ct Unit 1
- 2024 NE 36th Ct
- 2048 NE 36th Ct
- 2103 NE 36th Ct
- 2120 NE 38th Dr
- 2014 NE 38th Dr
- 3520 NE View Ave
- 2001 NE 36th Ct
- 2115 NE 36th Ct
- 2029 NE 35th St
- 2144 NE 38th Dr
- 1980 NE 38th Dr
Your Personal Tour Guide
Ask me questions while you tour the home.