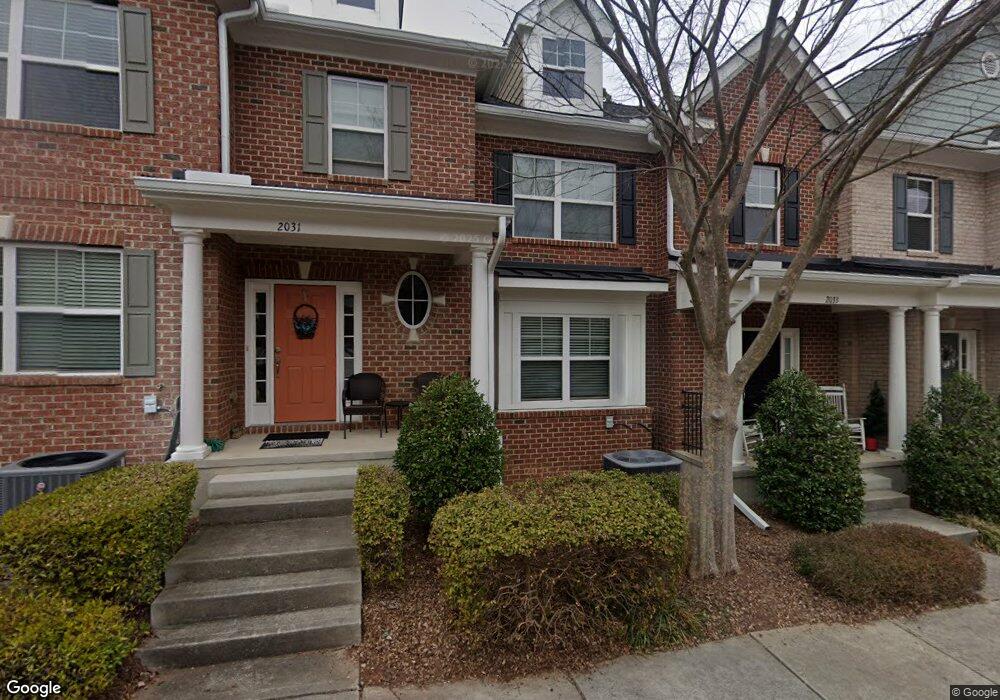
2033 Weston Green Loop Unit 45 Cary, NC 27513
Weston NeighborhoodEstimated Value: $453,000 - $539,786
2
Beds
4
Baths
2,169
Sq Ft
$231/Sq Ft
Est. Value
About This Home
This home is located at 2033 Weston Green Loop Unit 45, Cary, NC 27513 and is currently estimated at $500,197, approximately $230 per square foot. 2033 Weston Green Loop Unit 45 is a home located in Wake County with nearby schools including Northwoods Elementary School, West Cary Middle School, and Cary High School.
Ownership History
Date
Name
Owned For
Owner Type
Purchase Details
Closed on
Dec 29, 2010
Sold by
Foreverhome Llc
Bought by
Finnegan James C and Finnegan Mary L
Current Estimated Value
Home Financials for this Owner
Home Financials are based on the most recent Mortgage that was taken out on this home.
Original Mortgage
$187,920
Outstanding Balance
$122,413
Interest Rate
3.87%
Mortgage Type
Adjustable Rate Mortgage/ARM
Estimated Equity
$377,784
Purchase Details
Closed on
Aug 18, 2010
Sold by
Weston Place Llc
Bought by
Foreverhome Llc
Home Financials for this Owner
Home Financials are based on the most recent Mortgage that was taken out on this home.
Original Mortgage
$320,000
Interest Rate
4.61%
Mortgage Type
Purchase Money Mortgage
Purchase Details
Closed on
Jun 15, 2009
Sold by
Mcol Development Three Lp
Bought by
Weston Place Llc
Create a Home Valuation Report for This Property
The Home Valuation Report is an in-depth analysis detailing your home's value as well as a comparison with similar homes in the area
Home Values in the Area
Average Home Value in this Area
Purchase History
| Date | Buyer | Sale Price | Title Company |
|---|---|---|---|
| Finnegan James C | $235,000 | None Available | |
| Foreverhome Llc | $100,000 | None Available | |
| Weston Place Llc | $2,100,000 | None Available |
Source: Public Records
Mortgage History
| Date | Status | Borrower | Loan Amount |
|---|---|---|---|
| Open | Finnegan James C | $187,920 | |
| Previous Owner | Foreverhome Llc | $320,000 |
Source: Public Records
Tax History
| Year | Tax Paid | Tax Assessment Tax Assessment Total Assessment is a certain percentage of the fair market value that is determined by local assessors to be the total taxable value of land and additions on the property. | Land | Improvement |
|---|---|---|---|---|
| 2025 | $4,337 | $503,696 | $95,000 | $408,696 |
| 2024 | $4,243 | $503,696 | $95,000 | $408,696 |
Source: Public Records
Map
Nearby Homes
- 3067 Weston Green Loop
- 302 Peachtree Point Ct
- 1624 Wilson Rd
- 636 Chronicle Dr
- 208 Wildfell Trail
- 107 Carnie Ct
- 243 Windbyrne Dr
- 317 View Dr
- 201 Windbyrne Dr
- 314 Montelena Place
- 1144 Evans Rd
- 845 Rymark Ct
- 1133 Evans Rd
- 1109 Laurel Twist Rd
- 102 Anna Lake Ln
- 1103 Laurel Twist Rd
- 1005 Rexburg Dr
- 115 Abingdon Ct Unit 2b
- 104 Bailey Park Ct
- 101 Brant Point Place
- 2033 Weston Green Loop
- 2031 Weston Green Loop
- 2035 Weston Green Loop Unit 44
- 2035 Weston Green Loop
- 2029 Weston Green Loop
- 2029 Weston Green Loop Unit 47
- 2039 Weston Green Loop
- 2027 Weston Green Loop
- 2041 Weston Green Loop
- 2025 Weston Green Loop
- 2025 Weston Green Loop Unit 49
- 2043 Weston Green Loop
- 2030 Weston Green Loop
- 2028 Weston Green Loop
- 2021 Weston Green Loop
- 2026 Weston Green Loop
- 2024 Weston Green Loop
- 2019 Weston Green Loop Unit 51
- 2019 Weston Green Loop
- 2022 Weston Green Loop
Your Personal Tour Guide
Ask me questions while you tour the home.