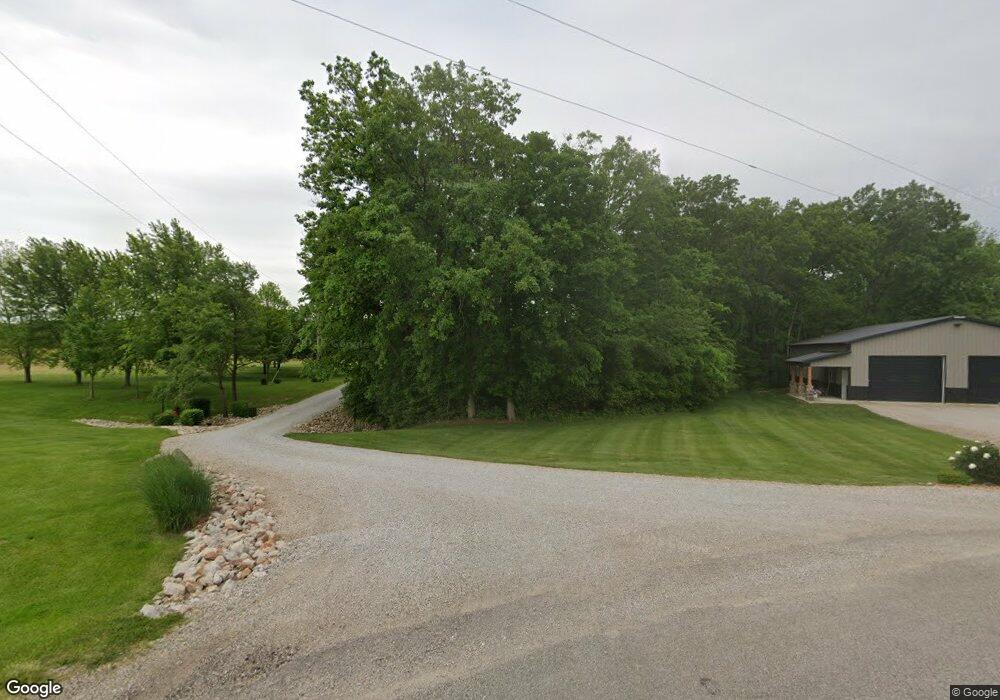
20336 Arrowhead Rd Ashmore, IL 61912
Estimated Value: $131,000 - $506,716
3
Beds
2
Baths
1,716
Sq Ft
$186/Sq Ft
Est. Value
About This Home
This home is located at 20336 Arrowhead Rd, Ashmore, IL 61912 and is currently estimated at $318,905, approximately $185 per square foot. 20336 Arrowhead Rd is a home located in Coles County with nearby schools including Charleston High School.
Ownership History
Date
Name
Owned For
Owner Type
Purchase Details
Closed on
Jan 4, 2019
Sold by
Yoder Trust
Bought by
Walker Jeron R and Walker Mackenzie J
Current Estimated Value
Home Financials for this Owner
Home Financials are based on the most recent Mortgage that was taken out on this home.
Original Mortgage
$80,000
Outstanding Balance
$70,619
Interest Rate
4.8%
Mortgage Type
New Conventional
Estimated Equity
$248,286
Purchase Details
Closed on
Oct 18, 2012
Sold by
Leach Robert L and Leach Clara R
Bought by
Walker Jeron R and Walker Mackenzie J
Home Financials for this Owner
Home Financials are based on the most recent Mortgage that was taken out on this home.
Original Mortgage
$95,000
Interest Rate
3.51%
Mortgage Type
New Conventional
Create a Home Valuation Report for This Property
The Home Valuation Report is an in-depth analysis detailing your home's value as well as a comparison with similar homes in the area
Purchase History
| Date | Buyer | Sale Price | Title Company |
|---|---|---|---|
| Walker Jeron R | $140,000 | None Available | |
| Walker Jeron R | $20,300 | None Available |
Source: Public Records
Mortgage History
| Date | Status | Borrower | Loan Amount |
|---|---|---|---|
| Open | Walker Jeron R | $80,000 | |
| Previous Owner | Walker Jeron R | $95,000 |
Source: Public Records
Tax History
| Year | Tax Paid | Tax Assessment Tax Assessment Total Assessment is a certain percentage of the fair market value that is determined by local assessors to be the total taxable value of land and additions on the property. | Land | Improvement |
|---|---|---|---|---|
| 2024 | $9,257 | $160,534 | $12,074 | $148,460 |
| 2023 | $6,184 | $152,889 | $11,499 | $141,390 |
| 2022 | $6,184 | $101,732 | $7,856 | $93,876 |
| 2021 | $6,614 | $97,631 | $7,539 | $90,092 |
| 2020 | $5,634 | $85,826 | $7,811 | $78,015 |
| 2019 | $5,527 | $82,836 | $7,539 | $75,297 |
| 2018 | $4,142 | $68,342 | $7,539 | $60,803 |
| 2017 | $4,123 | $68,342 | $7,539 | $60,803 |
| 2016 | $4,111 | $68,342 | $7,539 | $60,803 |
| 2015 | $3,077 | $68,342 | $7,539 | $60,803 |
| 2014 | $3,077 | $45,424 | $7,539 | $37,885 |
| 2013 | $3,077 | $45,424 | $7,539 | $37,885 |
Source: Public Records
Map
Nearby Homes
- 19511 Arrowhead Rd
- 9387 Nees St
- 21250 County Highway 17
- 18421 Chief Rd
- 21137 E Co Road 1050 N
- 000 Buxton Wood Dr
- 22654 E Co Road 1050 N
- Lot 67 Hawthorne Dr
- Lot 65 Hawthorne Dr
- Lot 60 Hawthorne Dr
- Lot 52 Hawthorne Dr
- Lot 47 Hawthorne Dr
- Lot 43 Hawthorne Dr
- Lot 63 Hawthorne Dr
- Lot 59 Hawthorne Dr
- Lot 49 Hawthorne Dr
- Lot 45 Hawthorne Dr
- Lot 55 Tippecanoe Ave
- 824 Hawthorne Dr
- 0 Harrison Street Rd
- 20236 Arrowhead Rd
- 0 Arrowhead Rd
- 0 Arrowhead Rd
- 20212 Arrowhead Rd
- 20136 Arrowhead Rd
- 20473 Arrowhead Rd
- 20604 Arrowhead Rd
- 19830 Arrowhead Rd
- 20040 Arrowhead Rd
- 20489 Arrowhead Rd
- 20483 Arrowhead Rd
- 20006 Arrowhead Rd
- 19972 Arrowhead Rd
- 20990 Arrowhead Rd
- 19830 Arrowhead Rd
- 19455 Arrowhead Rd
- 19672 Arrowhead Rd
- 19877 Harrison Street Rd
- 13179 County Road 720 N
- 13963 County Road 720 N
Your Personal Tour Guide
Ask me questions while you tour the home.