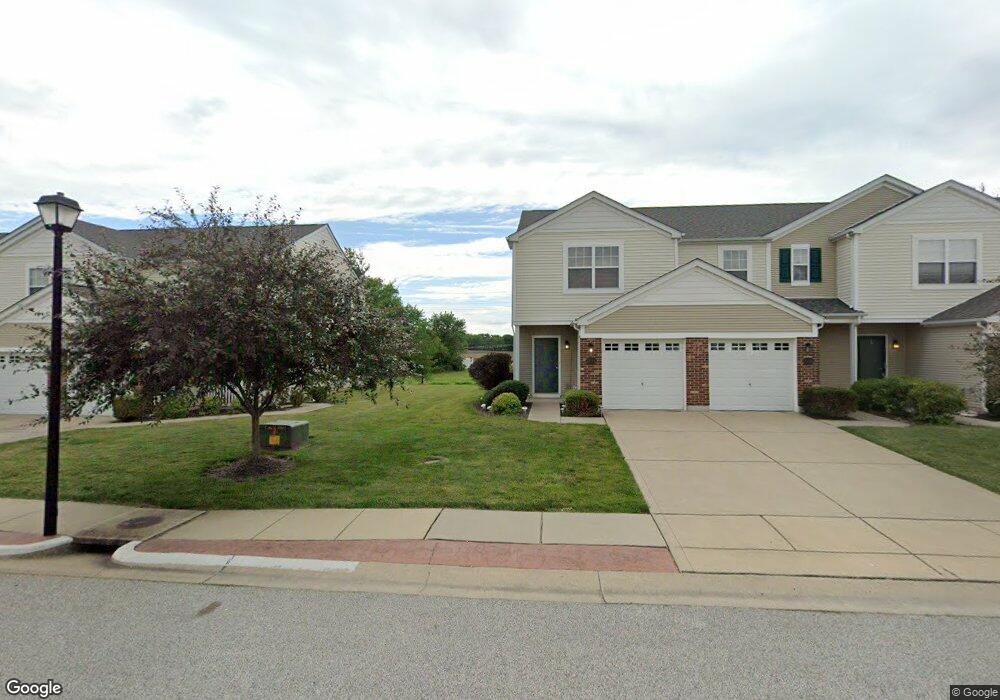
2034 Celebration Park Cir Belleville, IL 62220
Estimated Value: $125,000 - $168,000
2
Beds
2
Baths
1,140
Sq Ft
$131/Sq Ft
Est. Value
About This Home
This home is located at 2034 Celebration Park Cir, Belleville, IL 62220 and is currently estimated at $149,366, approximately $131 per square foot. 2034 Celebration Park Cir is a home located in St. Clair County with nearby schools including Westhaven Elementary School, Central Jr High School, and Notre Dame Academy of Belleville.
Ownership History
Date
Name
Owned For
Owner Type
Purchase Details
Closed on
May 14, 2008
Sold by
Treptow Kurt
Bought by
Tarbill April Heather and Tarbill April H
Current Estimated Value
Home Financials for this Owner
Home Financials are based on the most recent Mortgage that was taken out on this home.
Original Mortgage
$106,236
Outstanding Balance
$67,244
Interest Rate
5.87%
Mortgage Type
VA
Estimated Equity
$82,122
Purchase Details
Closed on
Jun 5, 2007
Sold by
The Jones Co Homes Llc
Bought by
Treptow Kurt
Home Financials for this Owner
Home Financials are based on the most recent Mortgage that was taken out on this home.
Original Mortgage
$87,068
Interest Rate
6.21%
Mortgage Type
Purchase Money Mortgage
Purchase Details
Closed on
Jan 6, 2006
Sold by
Reunion Development Llc
Bought by
The Jones Co Homes Llc
Create a Home Valuation Report for This Property
The Home Valuation Report is an in-depth analysis detailing your home's value as well as a comparison with similar homes in the area
Home Values in the Area
Average Home Value in this Area
Purchase History
| Date | Buyer | Sale Price | Title Company |
|---|---|---|---|
| Tarbill April Heather | $104,000 | Pti | |
| Treptow Kurt | $109,000 | Commerce Land Title Inc | |
| The Jones Co Homes Llc | $312,000 | Benchmark Title Company |
Source: Public Records
Mortgage History
| Date | Status | Borrower | Loan Amount |
|---|---|---|---|
| Open | Tarbill April Heather | $106,236 | |
| Previous Owner | Treptow Kurt | $87,068 |
Source: Public Records
Tax History Compared to Growth
Tax History
| Year | Tax Paid | Tax Assessment Tax Assessment Total Assessment is a certain percentage of the fair market value that is determined by local assessors to be the total taxable value of land and additions on the property. | Land | Improvement |
|---|---|---|---|---|
| 2024 | $3,461 | $39,356 | $4,767 | $34,589 |
| 2023 | $3,346 | $35,648 | $4,673 | $30,975 |
| 2022 | $3,072 | $32,092 | $4,207 | $27,885 |
| 2021 | $2,977 | $29,863 | $4,084 | $25,779 |
| 2020 | $2,894 | $28,240 | $3,862 | $24,378 |
| 2019 | $2,829 | $27,304 | $3,869 | $23,435 |
| 2018 | $2,766 | $26,713 | $3,785 | $22,928 |
| 2017 | $2,756 | $26,525 | $3,758 | $22,767 |
| 2016 | $2,734 | $25,961 | $3,678 | $22,283 |
| 2014 | $2,727 | $29,183 | $4,963 | $24,220 |
| 2013 | $2,699 | $29,600 | $5,034 | $24,566 |
Source: Public Records
Map
Nearby Homes
- 2056 Celebration Park Cir
- 1937 Richmond Springs Ln
- 133 Rivermeade Ln
- 1620 Westhaven Dr
- 1913 Plantation Ln
- 1909 Plantation Ln
- 1617 S Illinois St
- 91-110 Westhaven Meadows Dr
- 46 Meadowview Dr
- 244 River Laurel Dr
- 2042 Woodsong Way Ln
- 1433 Fairwood Dr
- 1412 Fairwood Dr
- 1500 State Street Rd
- 1250 Lakeshore Dr
- 1031 S Charles St
- 304 S Belt W
- 33 Forest Gate Dr
- 928 S High St
- 907 S Jackson St
- 2036 Celebration Park Cir
- 2030 Celebration Park Cir
- 2030 Celebration Cir
- 2038 Celebration Park Cir
- 2028 Celebration Park Cir
- 2040 Celebration Park Cir
- 2026 Celebration Park Cir
- 2042 Celebration Park Cir
- 2044 Celebration Park Cir
- 2024 Celebration Park Cir
- 2048 Celebration Park Cir
- 2020 Celebration Park Cir
- 2031 Celebration Park Cir
- 2050 Celebration Park Cir
- 2029 Celebration Park Cir
- 2027 Celebration Park Cir
- 2037 Celebration Park Cir
- 2025 Celebration Park Cir
- 2039 Celebration Park Cir
- 2052 Celebration Park Cir