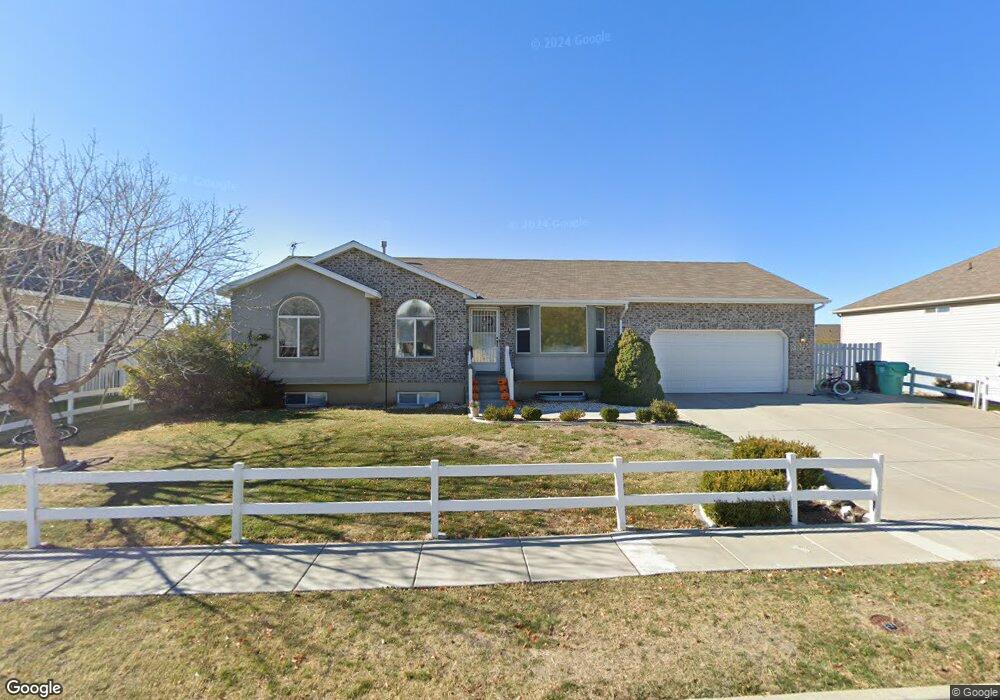
2034 S 1730 W Syracuse, UT 84075
Estimated Value: $522,000 - $593,000
6
Beds
2
Baths
2,530
Sq Ft
$221/Sq Ft
Est. Value
About This Home
This home is located at 2034 S 1730 W, Syracuse, UT 84075 and is currently estimated at $558,951, approximately $220 per square foot. 2034 S 1730 W is a home located in Davis County with nearby schools including Cook School, Syracuse Junior High School, and Syracuse High School.
Ownership History
Date
Name
Owned For
Owner Type
Purchase Details
Closed on
Aug 8, 2011
Sold by
Sanchez Lesbia A
Bought by
Calero Freddy G and Calero Susan M
Current Estimated Value
Home Financials for this Owner
Home Financials are based on the most recent Mortgage that was taken out on this home.
Original Mortgage
$170,400
Outstanding Balance
$116,953
Interest Rate
4.46%
Mortgage Type
New Conventional
Estimated Equity
$441,998
Purchase Details
Closed on
Aug 5, 2011
Sold by
Calero Freddy G
Bought by
Calero Freddy G and Calero Susan M
Home Financials for this Owner
Home Financials are based on the most recent Mortgage that was taken out on this home.
Original Mortgage
$170,400
Outstanding Balance
$116,953
Interest Rate
4.46%
Mortgage Type
New Conventional
Estimated Equity
$441,998
Purchase Details
Closed on
Nov 9, 2005
Sold by
Calero Freddy G
Bought by
Calero Freddy G and Sanchez Lesbia A
Purchase Details
Closed on
Apr 14, 2005
Sold by
Yennrenn Russal Y and Yennrenn Zola M
Bought by
Dcalon Freddy G
Home Financials for this Owner
Home Financials are based on the most recent Mortgage that was taken out on this home.
Original Mortgage
$37,200
Interest Rate
5.77%
Mortgage Type
Stand Alone Second
Purchase Details
Closed on
May 20, 2003
Sold by
Versemann Russell J
Bought by
Versemann Russell J and Versemann Zola M
Home Financials for this Owner
Home Financials are based on the most recent Mortgage that was taken out on this home.
Original Mortgage
$158,597
Interest Rate
5.77%
Mortgage Type
VA
Purchase Details
Closed on
Sep 6, 2002
Sold by
Versemann Russell J
Bought by
Versemann Russell J and Versemann Zola M
Home Financials for this Owner
Home Financials are based on the most recent Mortgage that was taken out on this home.
Original Mortgage
$157,507
Interest Rate
6.37%
Mortgage Type
VA
Purchase Details
Closed on
Mar 22, 2002
Sold by
Versemann Russell J
Bought by
Versemann Russell J and Versemann Zola M
Home Financials for this Owner
Home Financials are based on the most recent Mortgage that was taken out on this home.
Original Mortgage
$153,204
Interest Rate
6.85%
Mortgage Type
VA
Purchase Details
Closed on
Apr 2, 2001
Sold by
Saxey Kent H
Bought by
Gledhill Enterprises Inc
Home Financials for this Owner
Home Financials are based on the most recent Mortgage that was taken out on this home.
Original Mortgage
$121,500
Interest Rate
7.09%
Create a Home Valuation Report for This Property
The Home Valuation Report is an in-depth analysis detailing your home's value as well as a comparison with similar homes in the area
Home Values in the Area
Average Home Value in this Area
Purchase History
| Date | Buyer | Sale Price | Title Company |
|---|---|---|---|
| Calero Freddy G | -- | Bonneville Superior | |
| Calero Freddy G | -- | Bonneville Superior | |
| Calero Freddy G | -- | First American Title | |
| Dcalon Freddy G | -- | First American Title | |
| Versemann Russell J | -- | Bonneville Title Company Inc | |
| Versemann Russell J | -- | Bonneville Title Company Inc | |
| Versemann Russell J | -- | Bonneville Title Company Inc | |
| Versemann Russell J | -- | Bonneville Title Company Inc | |
| Versemann Russell J | -- | Equity Title Agency | |
| Versemann Russell J | -- | Equity Title Agency | |
| Gledhill Enterprises Inc | -- | Security Title Company |
Source: Public Records
Mortgage History
| Date | Status | Borrower | Loan Amount |
|---|---|---|---|
| Open | Calero Freddy G | $170,400 | |
| Closed | Calero Freddy G | $170,400 | |
| Previous Owner | Dcalon Freddy G | $37,200 | |
| Previous Owner | Dcalon Freddy G | $149,800 | |
| Previous Owner | Versemann Russell J | $158,597 | |
| Previous Owner | Versemann Russell J | $157,507 | |
| Previous Owner | Versemann Russell J | $153,204 | |
| Previous Owner | Gledhill Enterprises Inc | $121,500 |
Source: Public Records
Tax History Compared to Growth
Tax History
| Year | Tax Paid | Tax Assessment Tax Assessment Total Assessment is a certain percentage of the fair market value that is determined by local assessors to be the total taxable value of land and additions on the property. | Land | Improvement |
|---|---|---|---|---|
| 2025 | $2,902 | $279,950 | $123,707 | $156,243 |
| 2024 | $2,769 | $268,950 | $101,129 | $167,821 |
| 2023 | $2,576 | $456,000 | $140,978 | $315,022 |
| 2022 | $2,794 | $271,150 | $81,315 | $189,835 |
| 2021 | $2,523 | $379,000 | $120,031 | $258,969 |
| 2020 | $2,262 | $329,000 | $105,154 | $223,846 |
| 2019 | $2,201 | $316,000 | $102,057 | $213,943 |
| 2018 | $2,021 | $288,000 | $98,955 | $189,045 |
| 2016 | $1,766 | $132,000 | $38,008 | $93,992 |
| 2015 | $1,706 | $121,440 | $38,008 | $83,432 |
| 2014 | $1,626 | $117,953 | $38,008 | $79,945 |
| 2013 | -- | $114,012 | $32,571 | $81,441 |
Source: Public Records
Map
Nearby Homes
- 2194 S 1800 W
- 2306 S 2000 W
- 2104 W 2200 S
- 2136 W 2200 S
- 1656 Marilyn Dr
- 2237 Craig Ln
- 1306 W 2325 S
- 1466 Earl Cir
- 1286 W 2325 S
- 1315 W 2325 S
- 1295 W 2325 S
- 1142 W 2050 S
- 1148 W 2050 S
- 2355 S 1230 W
- 2208 W 2615 S Unit 141
- 2297 W 2175 S
- 1196 W 2325 S
- 1156 W 2325 S
- 4344 W 1825 S Unit 102
- 4354 W 1825 S Unit 104