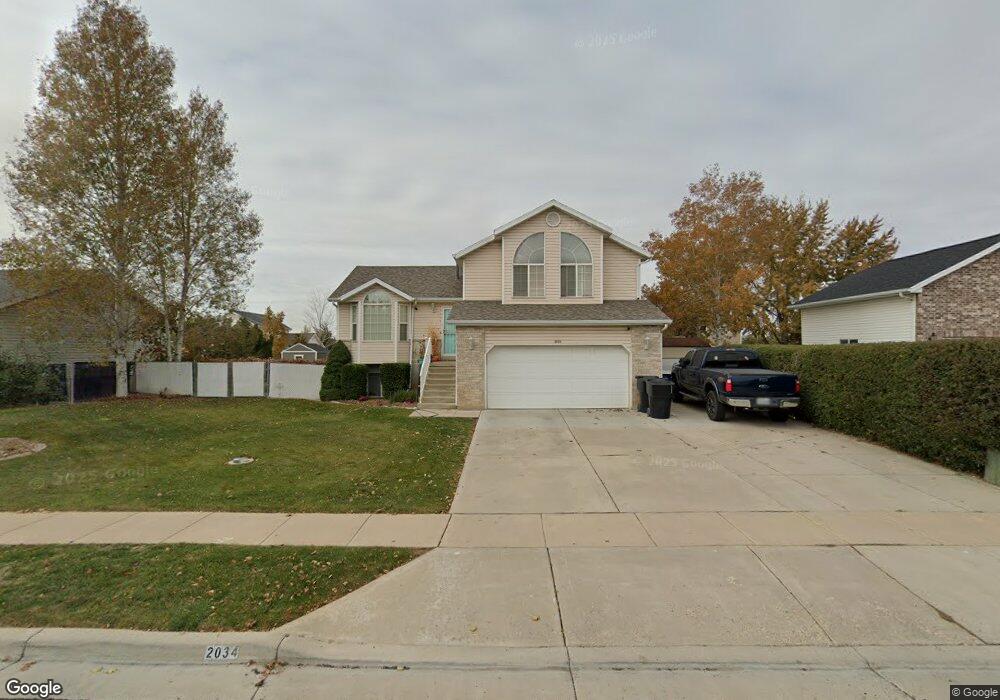
2034 S 1840 W Syracuse, UT 84075
Estimated Value: $519,000 - $535,000
3
Beds
3
Baths
1,667
Sq Ft
$315/Sq Ft
Est. Value
About This Home
This home is located at 2034 S 1840 W, Syracuse, UT 84075 and is currently estimated at $525,860, approximately $315 per square foot. 2034 S 1840 W is a home located in Davis County with nearby schools including Syracuse Elementary School, Syracuse Junior High School, and Syracuse High School.
Ownership History
Date
Name
Owned For
Owner Type
Purchase Details
Closed on
Aug 27, 2018
Sold by
Hudson Mark E and Hudson Jill
Bought by
Hudson Makr E and Hudson Jill
Current Estimated Value
Home Financials for this Owner
Home Financials are based on the most recent Mortgage that was taken out on this home.
Original Mortgage
$230,400
Outstanding Balance
$200,093
Interest Rate
4.5%
Mortgage Type
New Conventional
Estimated Equity
$325,767
Purchase Details
Closed on
Jun 13, 2016
Sold by
Hudson Mark E
Bought by
Hudson Jill M and Hudson Mark E
Purchase Details
Closed on
Dec 4, 2002
Sold by
Hudson Mark E
Bought by
Hudson Mark E and Hudson Jill M
Home Financials for this Owner
Home Financials are based on the most recent Mortgage that was taken out on this home.
Original Mortgage
$128,000
Interest Rate
5.65%
Purchase Details
Closed on
Sep 23, 1999
Sold by
Far West Construction & Development Inc
Bought by
Hudson Mark E and Hudson Jill M
Home Financials for this Owner
Home Financials are based on the most recent Mortgage that was taken out on this home.
Original Mortgage
$132,254
Interest Rate
8.09%
Mortgage Type
FHA
Purchase Details
Closed on
May 17, 1999
Sold by
Bodily Investments Llc
Bought by
Far West Construction & Development Inc
Home Financials for this Owner
Home Financials are based on the most recent Mortgage that was taken out on this home.
Original Mortgage
$114,400
Interest Rate
6.92%
Mortgage Type
Construction
Create a Home Valuation Report for This Property
The Home Valuation Report is an in-depth analysis detailing your home's value as well as a comparison with similar homes in the area
Home Values in the Area
Average Home Value in this Area
Purchase History
| Date | Buyer | Sale Price | Title Company |
|---|---|---|---|
| Hudson Makr E | -- | Backman Title | |
| Hudson Jill M | -- | Backman Title Services | |
| Hudson Mark E | -- | Backman Title Services | |
| Hudson Mark E | -- | Bonneville Title Company Inc | |
| Hudson Mark E | -- | Bonneville Title Company Inc | |
| Hudson Mark E | -- | Associated Title Company | |
| Far West Construction & Development Inc | -- | First American Title Co |
Source: Public Records
Mortgage History
| Date | Status | Borrower | Loan Amount |
|---|---|---|---|
| Open | Hudson Makr E | $230,400 | |
| Previous Owner | Hudson Mark E | $128,000 | |
| Previous Owner | Hudson Mark E | $10,000 | |
| Previous Owner | Hudson Mark E | $132,254 | |
| Previous Owner | Far West Construction & Development Inc | $114,400 | |
| Closed | Far West Construction & Development Inc | $8,750 |
Source: Public Records
Tax History Compared to Growth
Tax History
| Year | Tax Paid | Tax Assessment Tax Assessment Total Assessment is a certain percentage of the fair market value that is determined by local assessors to be the total taxable value of land and additions on the property. | Land | Improvement |
|---|---|---|---|---|
| 2025 | $2,554 | $246,400 | $125,831 | $120,569 |
| 2024 | $2,446 | $237,600 | $104,899 | $132,701 |
| 2023 | $2,271 | $402,000 | $146,116 | $255,884 |
| 2022 | $2,443 | $237,050 | $83,997 | $153,053 |
| 2021 | $2,184 | $328,000 | $124,222 | $203,778 |
| 2020 | $1,919 | $279,000 | $107,795 | $171,205 |
| 2019 | $1,825 | $262,000 | $105,873 | $156,127 |
| 2018 | $1,811 | $258,000 | $101,977 | $156,023 |
| 2016 | $1,545 | $115,445 | $39,123 | $76,322 |
| 2015 | $1,476 | $105,050 | $39,123 | $65,927 |
| 2014 | $1,464 | $106,148 | $39,123 | $67,025 |
| 2013 | -- | $107,330 | $32,326 | $75,004 |
Source: Public Records
Map
Nearby Homes
- 2082 S 1730 W
- 2194 S 1800 W
- 2104 W 2200 S
- 2306 S 2000 W
- 1932 S 2150 W
- 2136 W 2200 S
- 2237 Craig Ln
- 2503 S 1875 W
- 2297 W 2175 S
- 4344 W 1825 S Unit 102
- 4354 W 1825 S Unit 104
- 4348 W 1825 S Unit 103
- 1466 Earl Cir
- 2208 W 2615 S Unit 141
- 2198 W 2615 S Unit 140
- 2158 W 2615 S Unit 137
- 2650 S 2000 W
- 1306 W 2325 S
- 1315 W 2325 S
- 1641 S 2350 W Unit B
- 2018 S 1840 W
- 2050 S 1840 W
- 2039 S 1900 W
- 2085 S 1900 W
- 2015 S 1900 W
- 2057 S 1900 W
- 2066 S 1840 W
- 2101 S 1900 W Unit 206
- 2101 S 1900 W Unit 102
- 2035 S 1840 W
- 2051 S 1840 W
- 1997 S 1900 W
- 2019 S 1840 W
- 2075 S 1900 W
- 2075 S 1900 W Unit 2
- 1986 S 1840 W
- 2082 S 1840 W
- 2067 S 1840 W
- 2003 S 1840 W
- 2030 S 1900 W