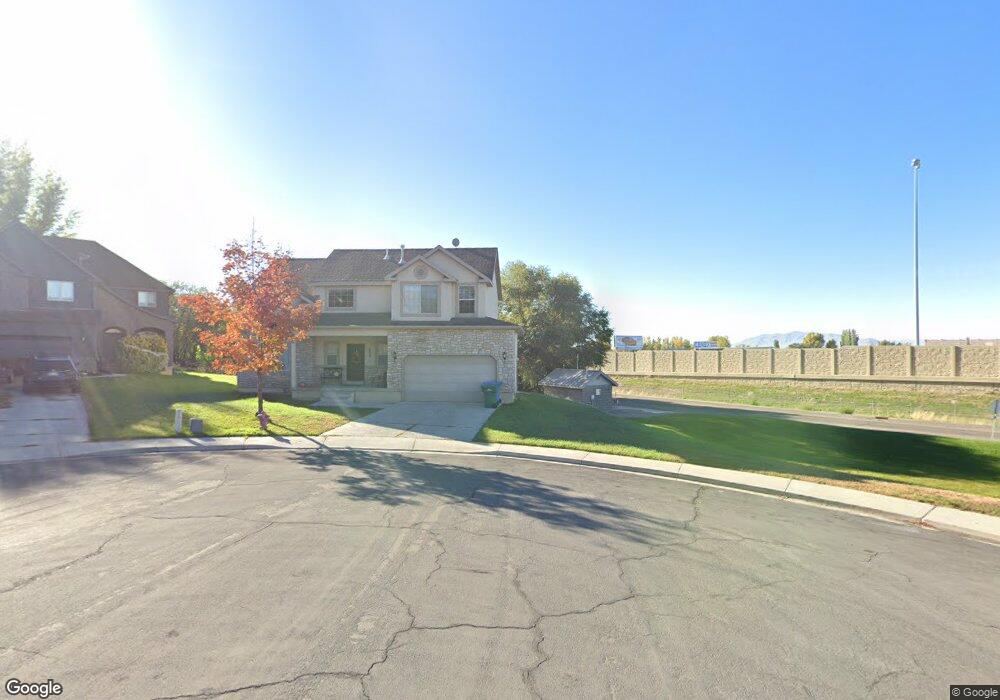
2034 S 330 W Orem, UT 84058
Lakeview NeighborhoodEstimated Value: $592,000 - $832,000
4
Beds
3
Baths
3,431
Sq Ft
$198/Sq Ft
Est. Value
About This Home
This home is located at 2034 S 330 W, Orem, UT 84058 and is currently estimated at $678,111, approximately $197 per square foot. 2034 S 330 W is a home located in Utah County with nearby schools including Cherry Hill Elementary School, Lakeridge Jr High School, and Mountain View High School.
Ownership History
Date
Name
Owned For
Owner Type
Purchase Details
Closed on
Aug 10, 2009
Sold by
Zions First National Bank
Bought by
Marshall Eugene and Marshall Rachelle
Current Estimated Value
Home Financials for this Owner
Home Financials are based on the most recent Mortgage that was taken out on this home.
Original Mortgage
$244,489
Outstanding Balance
$159,083
Interest Rate
5.17%
Mortgage Type
FHA
Estimated Equity
$519,028
Purchase Details
Closed on
Feb 24, 2009
Sold by
J Ballard Homes Inc
Bought by
Zions First National Bank
Create a Home Valuation Report for This Property
The Home Valuation Report is an in-depth analysis detailing your home's value as well as a comparison with similar homes in the area
Home Values in the Area
Average Home Value in this Area
Purchase History
| Date | Buyer | Sale Price | Title Company |
|---|---|---|---|
| Marshall Eugene | -- | Old Republic Title Company | |
| Zions First National Bank | $275,962 | Us Title Insurance Agency |
Source: Public Records
Mortgage History
| Date | Status | Borrower | Loan Amount |
|---|---|---|---|
| Open | Marshall Eugene | $244,489 |
Source: Public Records
Tax History Compared to Growth
Tax History
| Year | Tax Paid | Tax Assessment Tax Assessment Total Assessment is a certain percentage of the fair market value that is determined by local assessors to be the total taxable value of land and additions on the property. | Land | Improvement |
|---|---|---|---|---|
| 2025 | $2,433 | $308,550 | $234,200 | $326,800 |
| 2024 | $2,433 | $297,550 | $0 | $0 |
| 2023 | $2,300 | $302,225 | $0 | $0 |
| 2022 | $2,436 | $310,145 | $0 | $0 |
| 2021 | $2,270 | $437,700 | $182,900 | $254,800 |
| 2020 | $2,090 | $396,100 | $146,300 | $249,800 |
| 2019 | $1,930 | $380,300 | $146,300 | $234,000 |
| 2018 | $1,812 | $341,300 | $128,500 | $212,800 |
| 2017 | $1,802 | $181,830 | $0 | $0 |
| 2016 | $1,754 | $163,185 | $0 | $0 |
| 2015 | $1,811 | $159,335 | $0 | $0 |
| 2014 | $1,606 | $140,635 | $0 | $0 |
Source: Public Records
Map
Nearby Homes