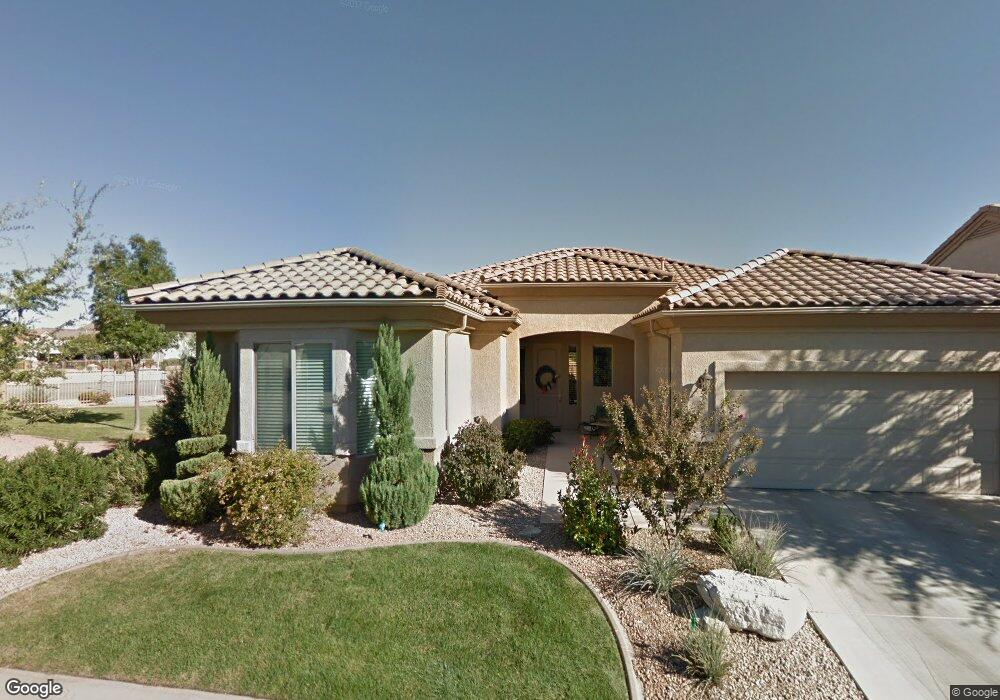
2034 Sunstar Dr Unit n/a St. George, UT 84790
SunRiver NeighborhoodEstimated Value: $556,000 - $574,000
2
Beds
3
Baths
2,165
Sq Ft
$262/Sq Ft
Est. Value
About This Home
This home is located at 2034 Sunstar Dr Unit n/a, St. George, UT 84790 and is currently estimated at $567,300, approximately $262 per square foot. 2034 Sunstar Dr Unit n/a is a home located in Washington County with nearby schools including Bloomington Elementary School, Dixie Middle School, and Tonaquint Intermediate School.
Ownership History
Date
Name
Owned For
Owner Type
Purchase Details
Closed on
May 25, 2021
Sold by
Vannoy Mary Van
Bought by
Smith Buddy R and Smith Brenda Jo
Current Estimated Value
Home Financials for this Owner
Home Financials are based on the most recent Mortgage that was taken out on this home.
Original Mortgage
$443,800
Outstanding Balance
$401,565
Interest Rate
3%
Mortgage Type
New Conventional
Estimated Equity
$165,735
Purchase Details
Closed on
Apr 16, 2007
Sold by
Knapp Gordon J and Knapp Diane K
Bought by
Vannoy Dean and Vannoy Van Noy
Purchase Details
Closed on
Mar 29, 2005
Sold by
Knapp Gordon J
Bought by
Knapp Gordon J and Knapp Diane K
Create a Home Valuation Report for This Property
The Home Valuation Report is an in-depth analysis detailing your home's value as well as a comparison with similar homes in the area
Home Values in the Area
Average Home Value in this Area
Purchase History
| Date | Buyer | Sale Price | Title Company |
|---|---|---|---|
| Smith Buddy R | -- | Us Title Ins Agency | |
| Vannoy Dean | -- | Mountain View Title St Georg | |
| Knapp Gordon J | -- | Accommodation |
Source: Public Records
Mortgage History
| Date | Status | Borrower | Loan Amount |
|---|---|---|---|
| Open | Smith Buddy R | $443,800 |
Source: Public Records
Tax History Compared to Growth
Tax History
| Year | Tax Paid | Tax Assessment Tax Assessment Total Assessment is a certain percentage of the fair market value that is determined by local assessors to be the total taxable value of land and additions on the property. | Land | Improvement |
|---|---|---|---|---|
| 2025 | $3,715 | $555,800 | $126,500 | $429,300 |
| 2023 | $316 | $323,840 | $66,440 | $257,400 |
| 2022 | $4,114 | $578,000 | $99,000 | $479,000 |
| 2021 | $2,145 | $449,500 | $93,500 | $356,000 |
| 2020 | $1,971 | $389,000 | $93,500 | $295,500 |
| 2019 | $1,952 | $376,300 | $93,500 | $282,800 |
| 2018 | $1,986 | $197,725 | $0 | $0 |
| 2017 | $2,017 | $194,975 | $0 | $0 |
| 2016 | $1,964 | $175,505 | $0 | $0 |
| 2015 | $1,914 | $164,120 | $0 | $0 |
| 2014 | $1,869 | $161,315 | $0 | $0 |
Source: Public Records
Map
Nearby Homes
- 2034 Sunstar Dr
- 2034 W Sunstar Cir
- 1915 W Sunstar Dr
- 4518 Clear Creek Ln
- 4593 S Flaming Arch Dr
- 4749 S Bonita Bay Dr
- 2109 W Vision Point Cir Unit 1037
- 1821 Wide River Dr
- 1826 Purple Lupine Dr
- 4444 S Big River Dr
- 4888 Bonita Bay Dr
- 1773 Wide River Dr
- 4613 Canyon Voices Dr W Unit 692
- 4532 Cold River Dr
- 1728 Wide River Dr
- 4491 Cold River Dr
- 1643 W Sunstar Dr
- 1673 Warm River Dr
- 1670 Warm River Dr
- 4975 S Bonita Bay Dr
- 2020 Sunstar Dr
- 2020 W Sunstar Cir
- 2035 W Sunstar Cir
- 2035 Sunstar Dr
- 2023 W Sunstar Cir
- 2047 W Sunstar Cir
- 2014 W Sunstar Cir
- 4588 S Deer Poppy Cir
- 1260 W Sun River Pkwy
- 2059 W Sunstar Cir
- 2017 W Sunstar Cir
- 2017 Sunstar Dr
- 2009 W Sunstar Cir
- 2036 Echo Springs Cir
- 1992 W Sunstar Dr
- 2018 Echo Springs Cir
- 2048 Echo Springs Cir
- 4595 S Deer Poppy Cir
- 4583 S Deer Poppy Cir
- 1997 W Sunstar Dr