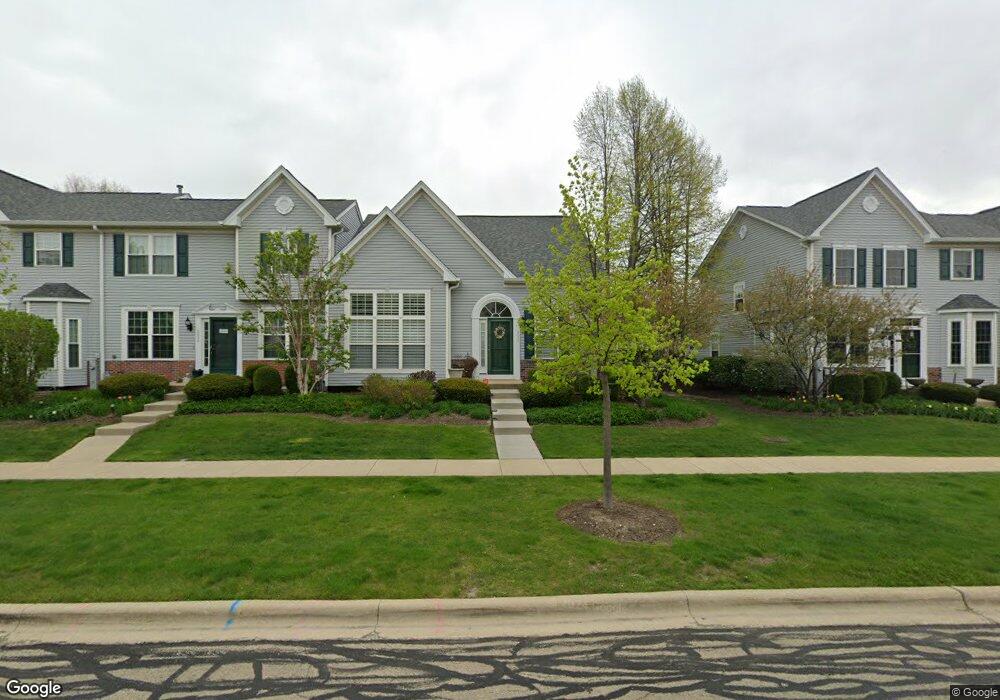
2034 Wagner Rd Batavia, IL 60510
Estimated Value: $351,596 - $402,000
2
Beds
--
Bath
1,864
Sq Ft
$199/Sq Ft
Est. Value
About This Home
This home is located at 2034 Wagner Rd, Batavia, IL 60510 and is currently estimated at $370,399, approximately $198 per square foot. 2034 Wagner Rd is a home located in Kane County with nearby schools including Hoover Wood Elementary School, Sam Rotolo Middle School, and Batavia Sr High School.
Ownership History
Date
Name
Owned For
Owner Type
Purchase Details
Closed on
Feb 13, 2013
Sold by
Grace Cheryl A
Bought by
Grace Cheryl A and The Cheryl A Grace Trust
Current Estimated Value
Purchase Details
Closed on
Jul 26, 2008
Sold by
Grace Cheryl and Blair Cheryl A
Bought by
Grace Cheryl
Home Financials for this Owner
Home Financials are based on the most recent Mortgage that was taken out on this home.
Original Mortgage
$195,200
Outstanding Balance
$128,492
Interest Rate
6.39%
Mortgage Type
New Conventional
Estimated Equity
$241,907
Purchase Details
Closed on
Mar 21, 2000
Sold by
American National Bk&Tr Co Of Chicago
Bought by
Blair Cheryl A
Home Financials for this Owner
Home Financials are based on the most recent Mortgage that was taken out on this home.
Original Mortgage
$170,000
Interest Rate
8.31%
Create a Home Valuation Report for This Property
The Home Valuation Report is an in-depth analysis detailing your home's value as well as a comparison with similar homes in the area
Home Values in the Area
Average Home Value in this Area
Purchase History
| Date | Buyer | Sale Price | Title Company |
|---|---|---|---|
| Grace Cheryl A | -- | None Available | |
| Grace Cheryl | -- | None Available | |
| Blair Cheryl A | $212,500 | Chicago Title Insurance Co |
Source: Public Records
Mortgage History
| Date | Status | Borrower | Loan Amount |
|---|---|---|---|
| Open | Grace Cheryl | $195,200 | |
| Closed | Blair Cheryl A | $170,000 | |
| Closed | Blair Cheryl A | $31,800 |
Source: Public Records
Tax History
| Year | Tax Paid | Tax Assessment Tax Assessment Total Assessment is a certain percentage of the fair market value that is determined by local assessors to be the total taxable value of land and additions on the property. | Land | Improvement |
|---|---|---|---|---|
| 2024 | $7,560 | $111,618 | $19,621 | $91,997 |
| 2023 | $7,320 | $101,305 | $17,808 | $83,497 |
| 2022 | $7,307 | $94,678 | $16,643 | $78,035 |
| 2021 | $6,985 | $89,793 | $15,784 | $74,009 |
| 2020 | $6,801 | $88,067 | $15,481 | $72,586 |
| 2019 | $6,669 | $84,949 | $14,933 | $70,016 |
| 2018 | $6,831 | $81,713 | $14,364 | $67,349 |
| 2017 | $6,662 | $79,018 | $13,890 | $65,128 |
| 2016 | $6,655 | $78,220 | $13,485 | $64,735 |
| 2015 | -- | $76,439 | $13,178 | $63,261 |
| 2014 | -- | $74,033 | $12,763 | $61,270 |
| 2013 | -- | $75,718 | $15,643 | $60,075 |
Source: Public Records
Map
Nearby Homes
- 2047 Swan Ln
- 2045 Stuttle Rd
- 2049 Stuttle Rd
- 2940 Arbor Ln
- 1402 Cherry Dr
- 3020 Abbey Cir
- 3075 Mesa Ln
- 3018 Abbey Cir
- 3026 Abbey Cir
- 3024 Abbey Cir
- 3005 Abbey Cir
- 3001 Abbey Cir
- 3003 Abbey Cir
- 1206 Beckman Ln
- 527 Ridgelawn Trail
- 1705 South Ct
- 1318 Fairfield Way Unit 2
- 2819 Clarissa Ln
- 1136 Pine Ct
- 608 Spyglass Ct
Your Personal Tour Guide
Ask me questions while you tour the home.